
Article Categories
- All Categories
-
 Data Structure
-
 Networking
-
 RDBMS
RDBMS
-
 Operating System
-
 Java
Java
-
 MS Excel
-
 iOS
iOS
-
 HTML
HTML
-
 CSS
CSS
-
 Android
-
 Python
-
 C Programming
-
 C++
C++
-
 C#
C#
-
 MongoDB
-
 MySQL
MySQL
-
 Javascript
-
 PHP
PHP
-
 Economics & Finance
How to Create Progress Bar Chart in Excel
A strong visualisation tool that lets you express and monitor progress towards a goal or task completion are progress bar charts. Progress bar charts can offer a simple and understandable visual depiction of your progress, whether you're tracking project milestones, sales targets, or personal goals.
In this tutorial, we'll take you step?by?step through the Excel progress bar charting procedure. From gathering your data to adjusting the chart's design, we'll cover it all. By the end of this tutorial, you will be able to effectively convey your progress to others by using your knowledge and abilities to construct dynamic and aesthetically pleasing progress bar charts in Excel.
It's not necessary to have any prior Excel charting knowledge to follow this tutorial. Beginning with the fundamentals, more complex approaches will be gradually introduced. So, regardless of your level of Excel proficiency, you're in the proper place. Let's get going and see how to make eye?catching progress bar charts in Excel!
Creating a Progress Bar Chart in Excel
Here we will first create a bar chart, format the chart, and then add data labels to the chart to complete the task. So let us see a simple process to know how you can create progress bar charts in Excel.
Step 1
Consider an Excel sheet where you have data in table format, similar to the below image.
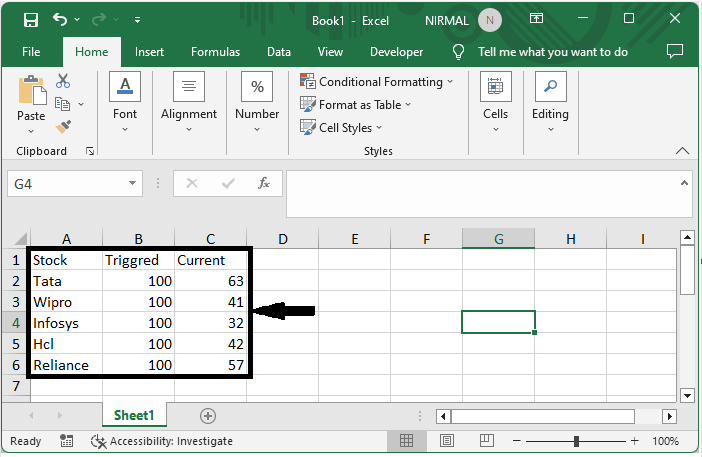
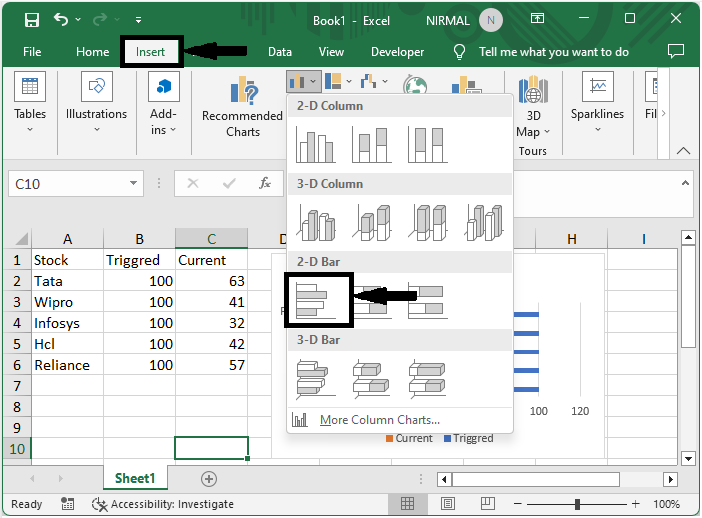
First, select the range of cells, then click on insert and select bar chart.
Select cells > Insert > Bar Chart.
Step 2
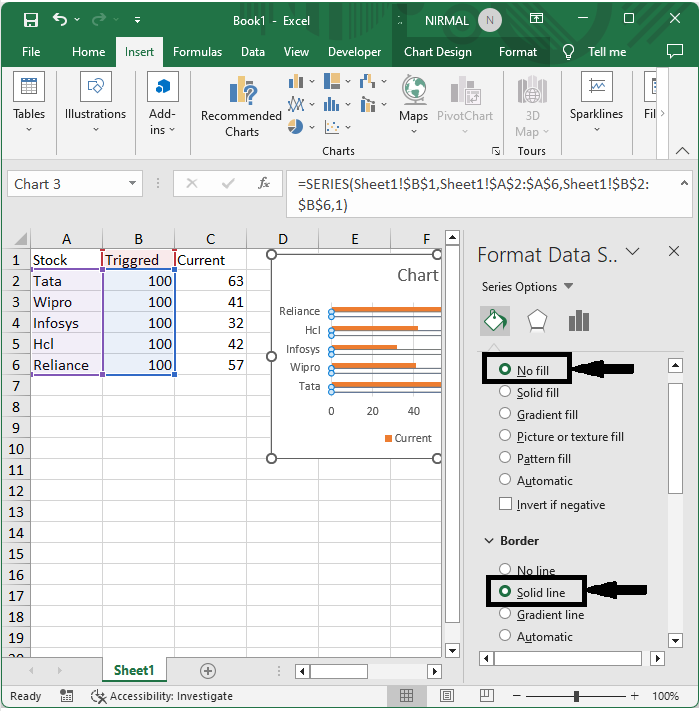
Then right?click on the chart, select Format Data Series, and set Fill to No Fill and Border to Solid Line.
Right click > Format data series > No Fill > Solid Line.
Step 3
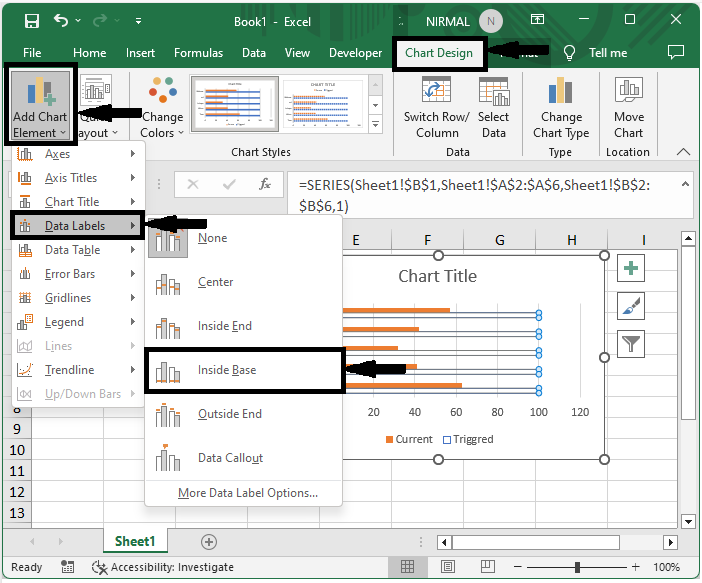
Now click on the chart and add chart elements under design, and click on the data labels and select Inside Base.
Chart > Design > Add Chart Elements > Data Labels > Inside Base.
Step 4
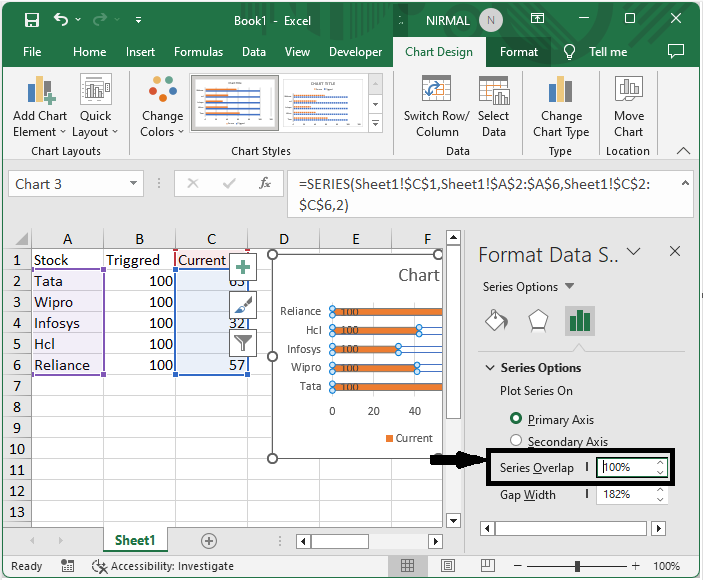
Then right?click on the series, select Format Data Series, and change the series overlap to 100%.
Right click > Format Data Series > Series Overlap.
This is how you can create a progress bar chart in Excel.
Conclusion
In this tutorial, we have used a simple example to demonstrate how you can create a progress bar chart in Excel to highlight a particular set of data.

6K+ Views
