- GWT Tutorial
- GWT - Home
- GWT - Overview
- GWT - Environment Setup
- GWT - Applications
- GWT - Create Application
- GWT - Deploy Application
- GWT - Style with CSS
- GWT - Basic Widgets
- GWT - Form Widgets
- GWT - Complex widgets
- GWT - Layout Panels
- GWT - Event Handling
- GWT - Custom Widgets
- GWT - UIBinder
- GWT - RPC Communication
- GWT - JUnit Integration
- GWT - Debugging Application
- GWT - Internationalization
- GWT - History Class
- GWT - Bookmark Support
- GWT - Logging Framework
- GWT Useful Resources
- GWT - Questions and Answers
- GWT - Quick Guide
- GWT - Useful Resources
- GWT - Discussion
GWT - Debugging Application
GWT provides execellent capability of debugging client side as well as server side code.
During development mode, GWT Application is in Java code based and is not translated to JavaScript.
When an application is running in development mode, the Java Virtual Machine (JVM) is actually executing the application code as compiled Java bytecode, using GWT capability to connect to a browser window.
GWT uses browser based plugin to connect to JVM.
So developers are free to use any Java based IDE to debug both client-side GWT Code as well as server-side code.
In this article we'll demonstrate usage of debugging GWT Client code using Eclipse. We'll do the following tasks −
- Set break points in the code and see them in BreakPoint Explorer.
- Step through the code line by line during debugging.
- View the values of variable.
- Inspect the values of all the variables.
- Inspect the value of an expression.
- Display the stack frame for suspended threads.
Debugging Example
This example will take you through simple steps to demonstrate debugging a GWT application. Follow the following steps to update the GWT application we created in GWT - Create Application chapter −
| Step | Description |
|---|---|
| 1 | Create a project with a name HelloWorld under a package com.tutorialspoint as explained in the GWT - Create Application chapter. |
| 2 | Modify HelloWorld.gwt.xml, HelloWorld.css, HelloWorld.html and HelloWorld.java as explained below. Keep rest of the files unchanged. |
| 3 | Compile and run the application to verify the result of the implemented logic. |
Following is the content of the modified module descriptor src/com.tutorialspoint/HelloWorld.gwt.xml.
<?xml version = "1.0" encoding = "UTF-8"?>
<module rename-to = 'helloworld'>
   <!-- Inherit the core Web Toolkit stuff.                        -->
   <inherits name = 'com.google.gwt.user.User'/>

   <!-- Inherit the default GWT style sheet.                       -->
   <inherits name = 'com.google.gwt.user.theme.clean.Clean'/>

   <!-- Specify the app entry point class.                         -->
   <entry-point class = 'com.tutorialspoint.client.HelloWorld'/>

   <!-- Specify the paths for translatable code                    -->
   <source path = 'client'/>
   <source path = 'shared'/>

</module>
Following is the content of the modified Style Sheet file war/HelloWorld.css.
body {
   text-align: center;
   font-family: verdana, sans-serif;
}

h1 {
   font-size: 2em;
   font-weight: bold;
   color: #777777;
   margin: 40px 0px 70px;
   text-align: center;
}

.gwt-Label{
   font-size: 150%;
   font-weight: bold;
   color:red;
   padding:5px;
   margin:5px;
}
Following is the content of the modified HTML host file war/HelloWorld.html to accomodate two buttons.
<html>
   <head>
      <title>Hello World</title>
      <link rel = "stylesheet" href = "HelloWorld.css"/>
      <script language = "javascript" src = "helloworld/helloworld.nocache.js">
      </script>
   </head>

   <body>
      <h1>Debugging Application Demonstration</h1>
      <div id = "gwtContainer"></div>
   </body>
</html>
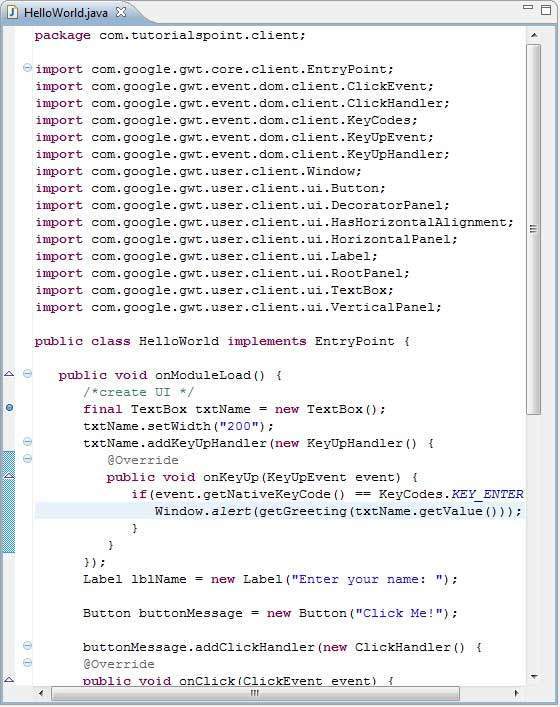
Let us have following content of Java file src/com.tutorialspoint/HelloWorld.java using which we will demonstrate debugging capability of GWT Code.
package com.tutorialspoint.client;

import com.google.gwt.core.client.EntryPoint;
import com.google.gwt.event.dom.client.ClickEvent;
import com.google.gwt.event.dom.client.ClickHandler;
import com.google.gwt.event.dom.client.KeyCodes;
import com.google.gwt.event.dom.client.KeyUpEvent;
import com.google.gwt.event.dom.client.KeyUpHandler;
import com.google.gwt.user.client.Window;
import com.google.gwt.user.client.ui.Button;
import com.google.gwt.user.client.ui.DecoratorPanel;
import com.google.gwt.user.client.ui.HasHorizontalAlignment;
import com.google.gwt.user.client.ui.HorizontalPanel;
import com.google.gwt.user.client.ui.Label;
import com.google.gwt.user.client.ui.RootPanel;
import com.google.gwt.user.client.ui.TextBox;
import com.google.gwt.user.client.ui.VerticalPanel;

public class HelloWorld implements EntryPoint {

   public void onModuleLoad() {
      /*create UI */
      final TextBox txtName = new TextBox();
      txtName.setWidth("200");
      txtName.addKeyUpHandler(new KeyUpHandler() {
         @Override
         public void onKeyUp(KeyUpEvent event) {
            if(event.getNativeKeyCode() == KeyCodes.KEY_ENTER){
               Window.alert(getGreeting(txtName.getValue()));
            }
         }
      });
      Label lblName = new Label("Enter your name: ");

      Button buttonMessage = new Button("Click Me!");

      buttonMessage.addClickHandler(new ClickHandler() {
      @Override
      public void onClick(ClickEvent event) {
         Window.alert(getGreeting(txtName.getValue()));
      }});

      HorizontalPanel hPanel = new HorizontalPanel();
      hPanel.add(lblName);
      hPanel.add(txtName);
      hPanel.setCellWidth(lblName, "130");

      VerticalPanel vPanel = new VerticalPanel();
      vPanel.setSpacing(10);
      vPanel.add(hPanel);
      vPanel.add(buttonMessage);
      vPanel.setCellHorizontalAlignment(buttonMessage,
      HasHorizontalAlignment.ALIGN_RIGHT);

      DecoratorPanel panel = new DecoratorPanel();
      panel.add(vPanel);

      // Add widgets to the root panel.
      RootPanel.get("gwtContainer").add(panel);
   }

   public String getGreeting(String name){
      return "Hello "+name+"!";
   }
}
Step 1 - Place BreakPoints
Place a breakpoint on the first line of onModuleLoad() of HelloWorld.java
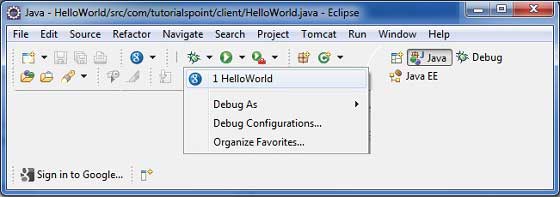
Step 2 - Debug Application
Now click on ![]() Debug application menu and select HelloWorld application to debug the application.
Debug application menu and select HelloWorld application to debug the application.
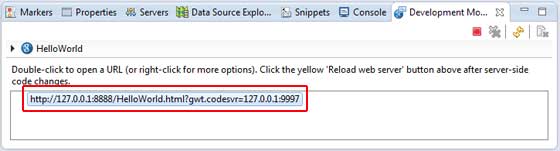
If everything is fine, you must see GWT Development Mode active in Eclipse containing a URL as shown below. Double click the URL to open the GWT application.
As soon as Application launches, you will see the focus on Eclipse breakpoint as we've placed the breakpoint on first line of entry point method.
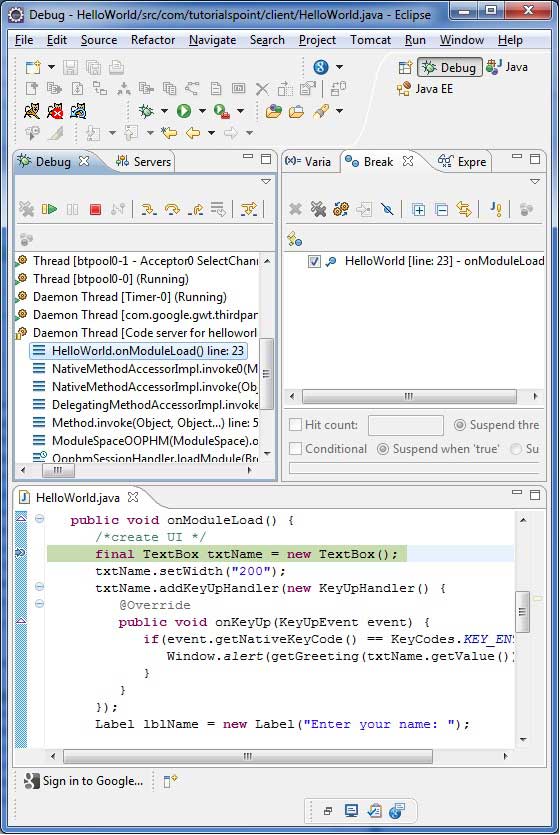
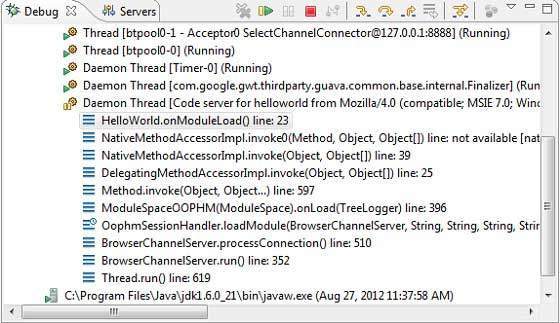
You can see the stacktrace for suspended threads.
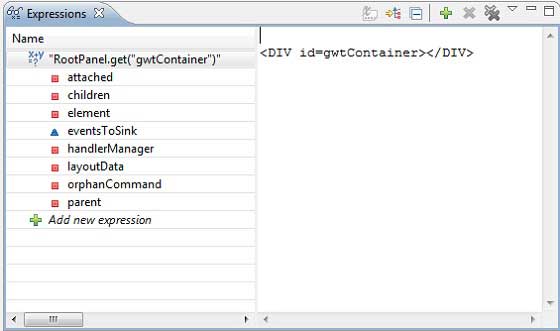
You can see the values for expressions.
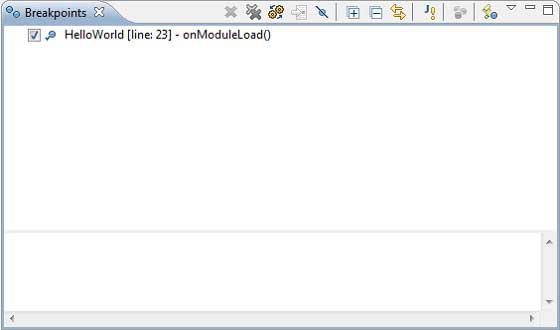
You can see the list of breakpoints placed.
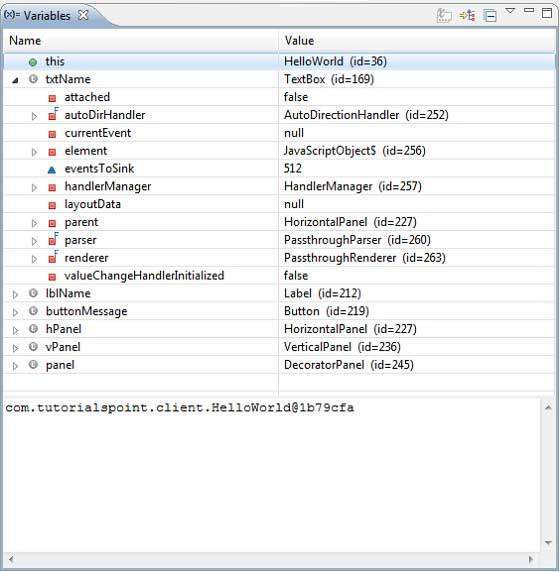
Now keep pressing F6 until you reach the last line of onModuleLoad() method. As reference for function keys, F6 inspects code line by line, F5 steps inside further and F8 will resume the application. Now you can see the list of values of all variables of onModuleLoad() method.
The GWT client code can be debugged in the same way as a Java Application can be debugged. Place breakpoints to any line and play with debugging capabilities of GWT.