- Excel Power View Tutorial
- Excel Power View - Home
- Overview
- Creation
- Sheet
- Visualizations
- Table Visualization
- Matrix Visualization
- Card Visualization
- Chart Visualizations
- Line Chart Visualization
- Bar Chart Visualization
- Column Chart Visualization
- Scatter & Bubble Chart Visualization
- Pie Chart Visualization
- Map Visualization
- Multiple Visualizations
- Tiles Visualizations
- Advanced Features
- Excel Power View and Data Model
- Hierarchies
- Key Performance Indicators
- Formatting a Report
- Sharing
- Excel Power View Useful Resources
- Excel Power View - Quick Guide
- Excel Power View - Useful Resources
- Excel Power View - Discussion
Excel Power View - Bar Chart Visualization
Bar Charts are used for comparing data points in one or more data series. In a Bar Chart, categories are organized along the vertical axis and values along the horizontal axis.
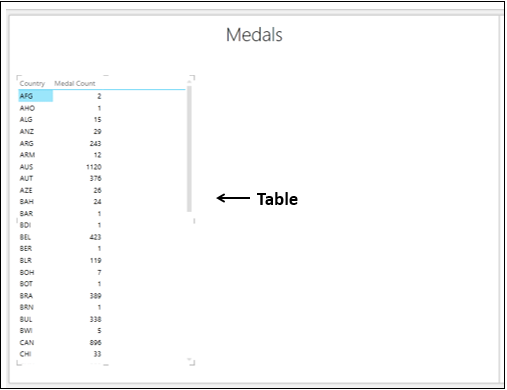
As you know from the previous chapters, you need to start with a Table and then convert it to Bar Chart visualization.
Select the fields – Country and Medal Count. By default, Table will be displayed.
Types of Bar Chart Visualization
In Power View, there are three types of Bar Chart visualization −
- Stacked Bar.
- 100% Stacked Bar.
- Clustered Bar.
Switching to Bar Chart Visualization
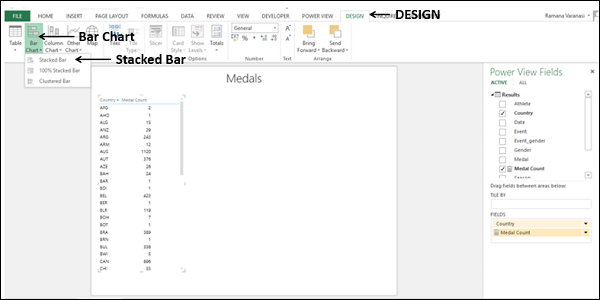
Convert the Table to Bar Chart as follows −
- Click on the Table.
- Click the DESIGN tab.
- Click Bar Chart in the Switch Visualization group.
- Select Stacked Bar from the dropdown list.
The Table is converted to Bar Chart.
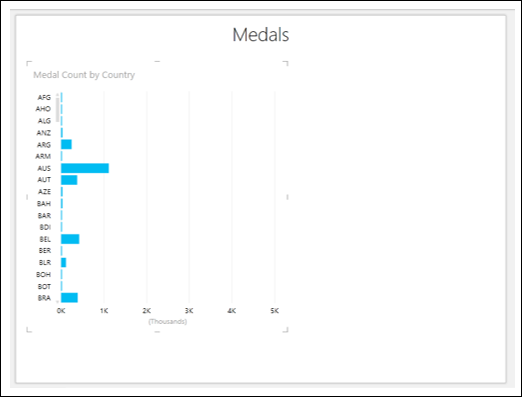
You can see that Y-axis values are sorted by the category values in ascending order.
Exploring Data with Bar Chart Visualization
You can explore data with Bar Chart in several ways. You will understand the various methods that you can use for data visualization and exploration with Bar Chart in this section and the subsequent sections.
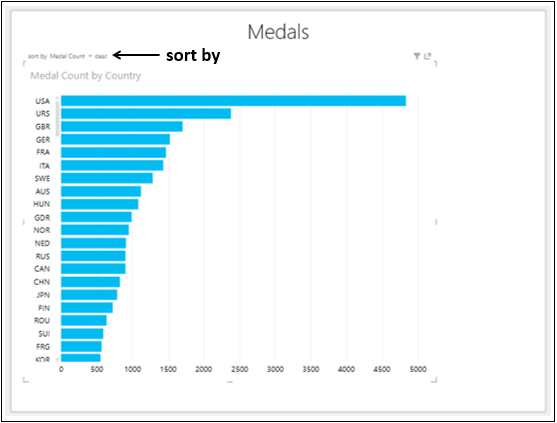
You can sort the Y-axis values in Bar Chart by the Medal Count as follows −
Take the cursor to above the Bar Chart. On the top left corner, you will find – sort by Country asc. This means the sorting is by Country and in ascending order.
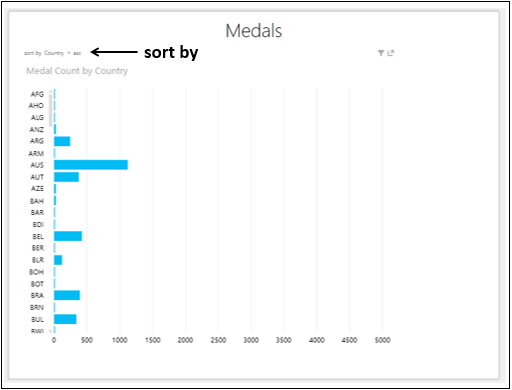
Click on Country. It will change to Medal Count.
Click asc. It will change to desc. The Bar Chart will be sorted by Medal Count in descending order.
Combination of Bar Chart and Table Visualizations
You can view the interactive features of Bar Chart visualizations by placing a Table on the same Power View.
Create a Table with the fields, Country and Medal Count.
Adjust the sizes and positions of Bar Chart and Table to appear as below.
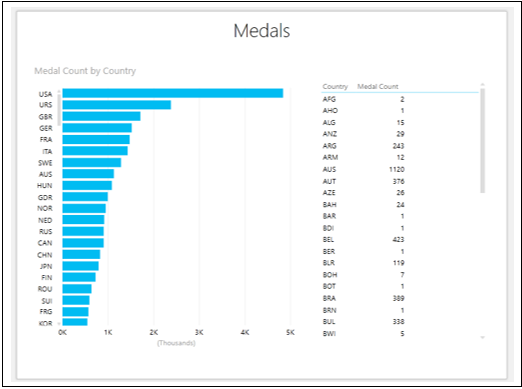
From the Bar Chart, you can see that USA has the highest Medal Count.
Click on the Bar for USA. That Bar will be highlighted and other Bars will be inactive. The Table is filtered to show the values only for the selected Bar.
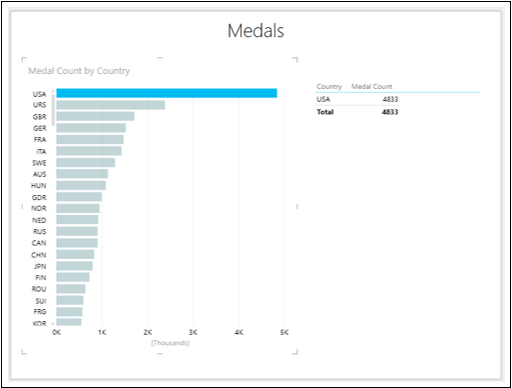
The highest Medal Count is of USA with 4833 as displayed in the Table.
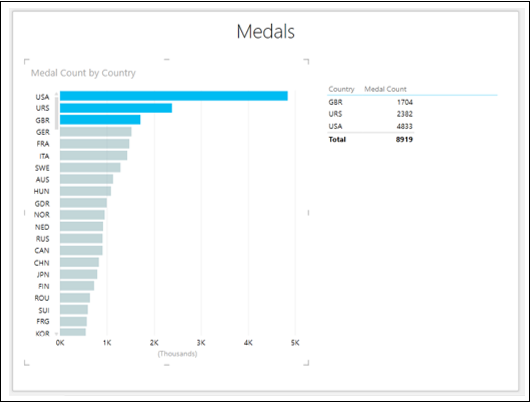
To find the top three Medal Counts, proceed as follows −
Click on the Bar with Category USA. Only that Bar will be highlighted.
With Ctrl key pressed, click on Bars with Categories URS and GBR that are in second and third places. The Bars for USA, URS and GBR will be highlighted.
The Table also shows values for these three Categories only.
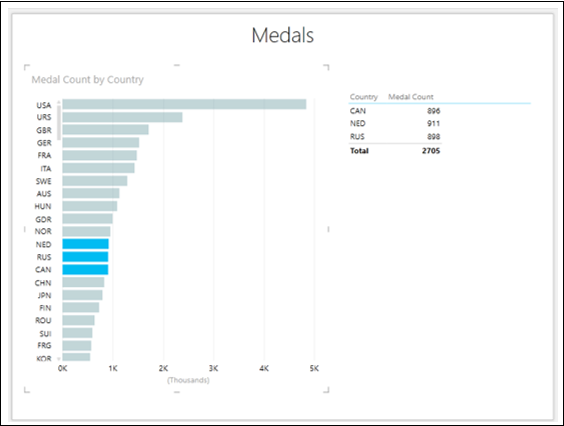
From the Bar Chart, you can also observe that the values for NED, RUS and CAN are almost equal.
Click on the Bar NED.
With Ctrl key pressed, click on the Bars RUS and CAN. The Bars for NED, RUS and CAN will be highlighted.
The Table also shows values for these three Categories only.
Adding a Legend
You can observe more powerful features of Bar Chart by adding a Legend.
- Click on the Bar Chart.
- Drag the field Medal to LEGEND area.
- Click on the Table.
- Drag the field Medal to FIELDS area.
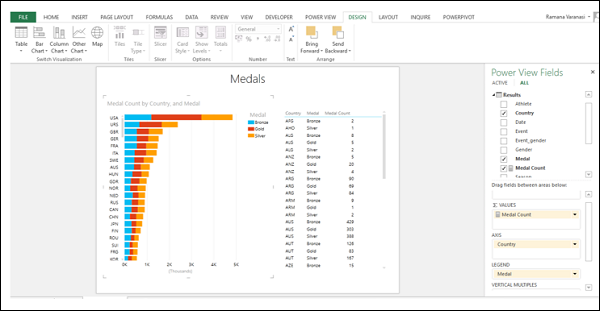
As you can see, this is a full-fledged Stacked Bar Chart visualization, showing the Medal Count by Medal type for each Country.
Click on the orange color portion of the Bar for GER.
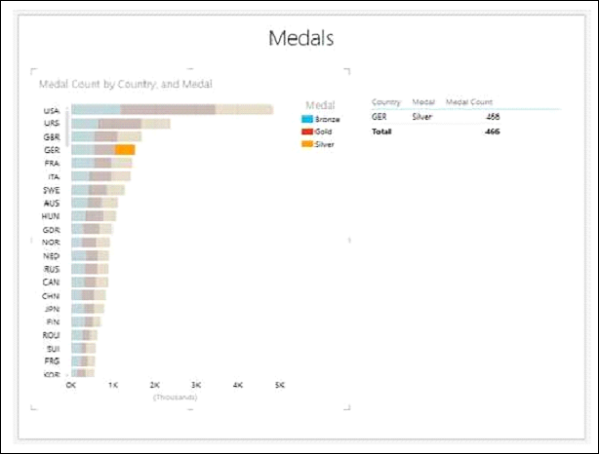
You can observe the following −
Only the orange color portion of the Bar for GER on which you clicked will be highlighted.
The other two portions of the Bar for GER will become inactive.
All other Bars will become inactive .
The Table will be filtered to show only the values of highlighted region.
Note − You cannot make multiple selections in this case.
100% Stacked Bar Chart
You can convert the Stacked Bar Chart to 100% Stacked Bar Chart as follows −
Click on the Stacked Bar Chart.
Click the DESIGN tab on the Ribbon.
Click on Bar Chart.
Select 100% Stacked Bar from the dropdown list.
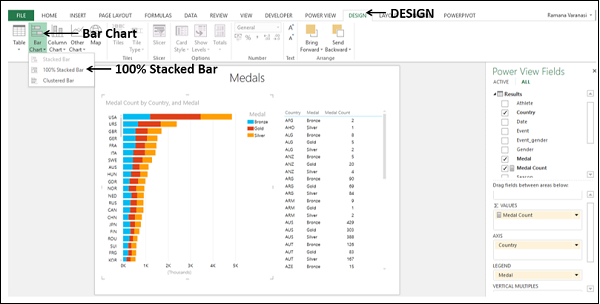
Your Stacked Bar Chart will be converted to 100% Stacked Bar Chart as shown below.
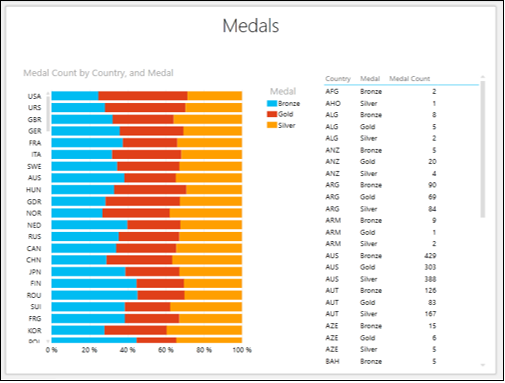
From the Chart, you can visualize the Gold, Silver and Bronze ratios of the total Medal Count for each country.
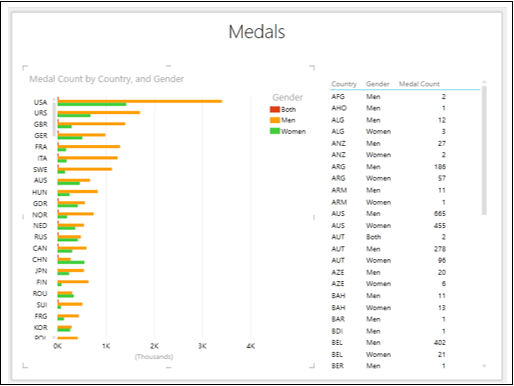
You can also visualize the ratio of the Medals won by Men and Women for each country.
Remove the field Medal and add the field Gender to both Bar Chart and Table.
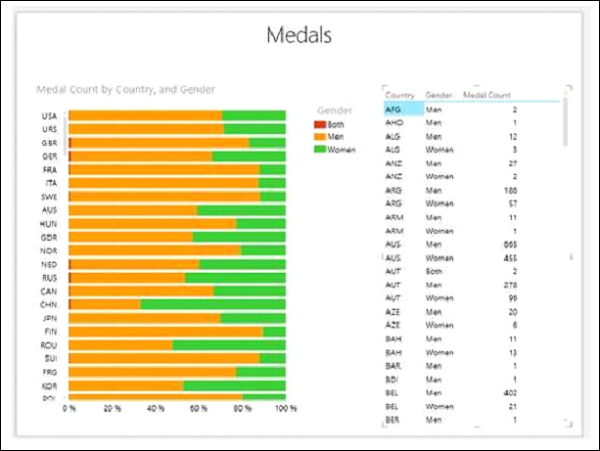
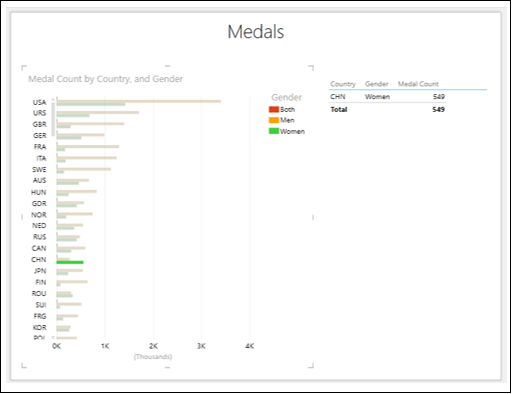
Observe that for CHN, the Medal Count for Women is more than that for Men as against other countries.
Scroll down the Table to view the values for CHN.
In country CHN, the Medal Count for Men is 268 and that for Women is 549.
Clustered Bar Chart
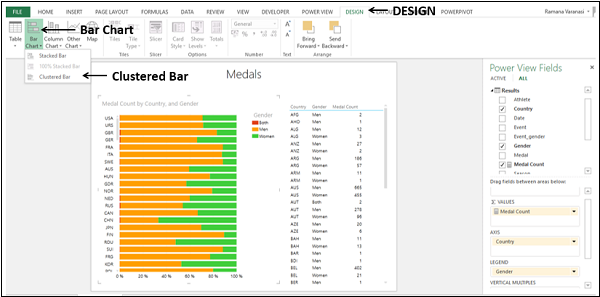
You can convert the 100% Stacked Bar Chart to Clustered Bar Chart as follows −
Click on the 100% Stacked Bar Chart.
Click the DESIGN tab on the Ribbon.
Click on Bar Chart.
Select Clustered Bar from the dropdown list.
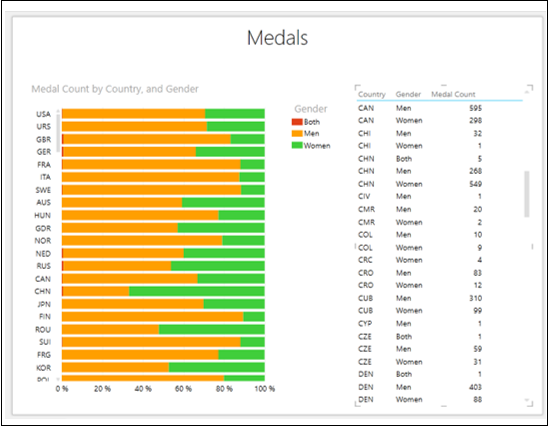
The 100% Stacked Bar chart will be converted to Clustered Bar chart.
Click on the Green Bar for CHN.
You will observe the following −
- Only the selected bar will be highlighted.
- Other Bars will become inactive.
- The Table shows only the corresponding values.