- Excel Power View Tutorial
- Excel Power View - Home
- Overview
- Creation
- Sheet
- Visualizations
- Table Visualization
- Matrix Visualization
- Card Visualization
- Chart Visualizations
- Line Chart Visualization
- Bar Chart Visualization
- Column Chart Visualization
- Scatter & Bubble Chart Visualization
- Pie Chart Visualization
- Map Visualization
- Multiple Visualizations
- Tiles Visualizations
- Advanced Features
- Excel Power View and Data Model
- Hierarchies
- Key Performance Indicators
- Formatting a Report
- Sharing
- Excel Power View Useful Resources
- Excel Power View - Quick Guide
- Excel Power View - Useful Resources
- Excel Power View - Discussion
Excel Power View - Sheet
In the previous chapter, you have created a Power View sheet and a Power View on the Power View sheet. Note that you can create multiple Power Views on a Power View sheet. They are called Visualizations. You will learn about the various different visualizations that you can create on a Power View sheet in the subsequent chapters. Before you learn about the different visualizations, you need to understand the various parts of the Power View sheet.
Power View Sheet Layout
The Power View sheet layout looks as follows −
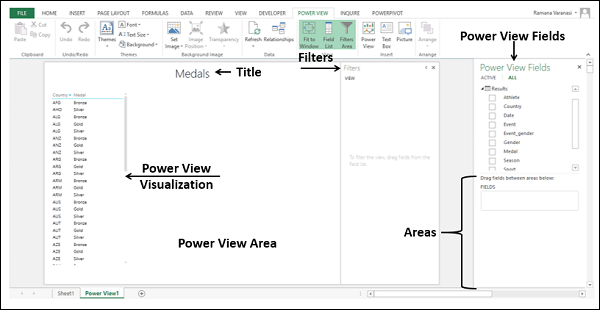
You can find the following different parts on the Power View sheet.
- Power View Area.
- Power View Visualizations.
- Power View Title.
- Power View Fields List.
- Filters.
Power View Area
Power View area is like a canvas on which you can create multiple different visualizations based on the data in the Data Model. You can have multiple visualizations in the Power View area and work on them either collectively or separately. To create a new visualization, you need to click on an empty part of the Power View area, and select the fields that you want to display in the visualization.
Power View Visualizations
The variety of visualizations that Power View provides is the strength of Power View. You can have any number of visualizations on the Power View area and each with different size and different layout. For example, you can have a Table visualization, a Chart visualization and a Map visualization on a single Power View. The fields that are displayed in the visualizations can be individually chosen.
The sizes of the visualizations can be different.
To resize a visualization, do the following −
Click on the symbol
 in the top right corner, or
Click on the symbol
 in the bottom right corner and pull the arrow that appears
Pop out and Pop in
You can make a visualization to occupy the entire Power View area with the Pop out button  that appears on the top right corner of the visualization.
Move the cursor to the Table visualization.
Move to the top right corner of the Table visualization. The Pop out button is highlighted.
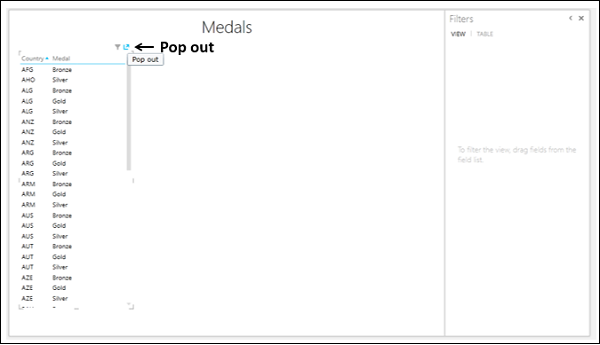
Click the Pop out button. The Table visualization pops out to the entire Power View area.
The Pop out button changes to Pop in button.
Click the Pop in button.
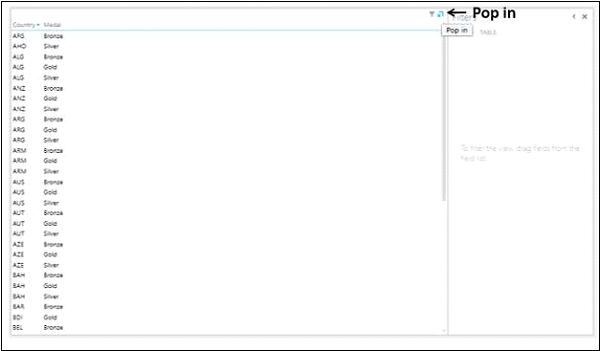
The Table visualization reverts to the original size.
Power View Fields List
The Power View Fields list displays all the tables in the Data Model and the corresponding fields. By selecting the fields, you can display the required data in a visualization. Note that you can choose different fields for the different visualizations on a Power View sheet. This makes Power View a versatile and collective tool to visualize the different aspects of the data in the Data Model.
While the selected fields in the Power View Fields list determine what data is to be displayed in a visualization, the areas below the Fields list determine how the data is to be displayed. For example, you might choose to display the fields - Country, Sport, Gender, and Medal Count in the visualization. While placing these fields in the Areas, you can opt to display Gender as a Legend. You will learn the different types of Areas and the way they can change the layout of a visualization in the subsequent chapters.
Title
The Title in a Power View sheet is for the entire sheet. Therefore, while giving a Title, see to that it meets the objective of the entire Power View report.
Filters
The Filters area allows you to filter the fields for specific data that is to be displayed. You can choose to apply a filter to the entire View, i.e. all the visualizations or only the selected visualization.
Click Table visualization.
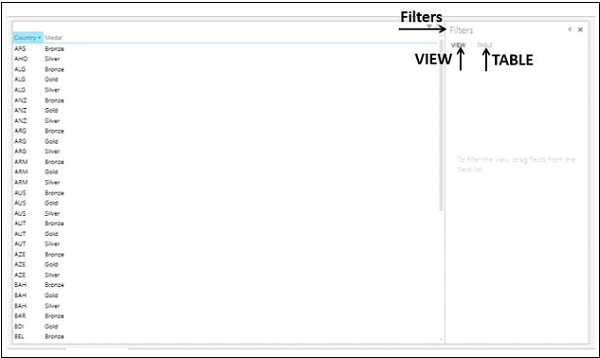
As you can observe, the Filters area has two tabs – VIEW and TABLE.
If you click the tab TABLE and apply the filters to fields, only the data in the selected TABLE visualization will be filtered.
If you click on the tab VIEW and apply the filters to fields, the data in all the visualizations in the Power View sheet will be filtered.
If the visualization is other than Table, say Matrix, then the tabs in the Filters area will be VIEW and MATRIX.
You will learn about Filters in detail in the chapter - Combination of Power View Visualizations.
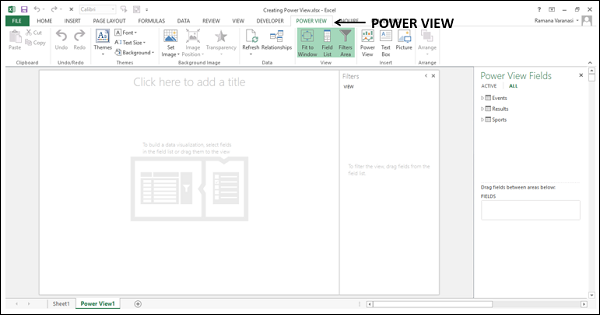
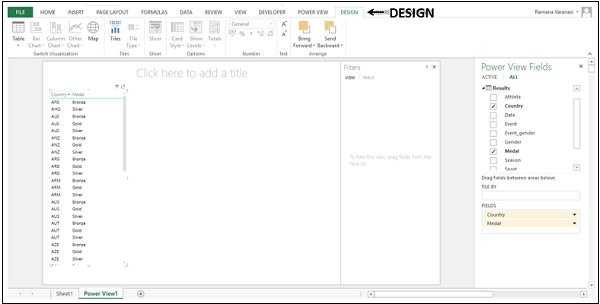
Power View Tabs on the Ribbon
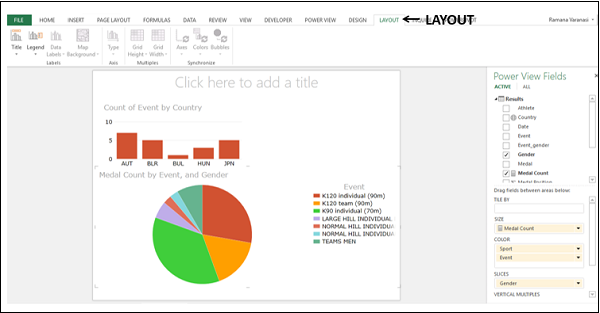
Power View has three tabs on the Ribbon − Power View, Design, and Layout.
When you create a Power View Sheet, the tab – POWER VIEW is added to the Ribbon.
When you create a Power View (visualization) such as Table visualization and click it, the tab – DESIGN is added to the Ribbon.
When you switch visualization to a Chart or Map, the tab – LAYOUT is added to the Ribbon.