- Data Modeling with DAX Tutorial
- Home
- Data Modeling with DAX - Overview
- Data Modeling with DAX - Concepts
- Data Modeling Using Excel Power Pivot
- Loading Data into the Data Model
- Defining Data Types in the Data Model
- Understanding Data Tables
- Extending the Data Model
- Base Finance Measures & Analysis
- YoY Finance Measures & Analysis
- Variance Measures & Analysis
- Year-to-Date Measures & Analysis
- Quarter-to-Date Measures & Analysis
- Budget Measures & Analysis
- Forecast Measures & Analysis
- Count of Months Measures
- Ending Headcount Measures
- Average Headcount Measures
- Total Headcount Measures
- YoY Headcount Measures & Analysis
- Variance Headcount Measures
- Cost Per Headcount Measures & Analysis
- Rate Variance & Volume Variance
- Data Modeling with DAX Resources
- Quick Guide
- Useful Resources
- Discussion
Rate Variance and Volume Variance
You have learnt how to create measures for Annualized Cost Per Head and Total Headcount. You can use these measures to create Rate Variance and Volume Variance measures.
Rate Variance measures calculate what portion of a Currency Variance is caused by differences in Cost Per Head.
Volume Variance measures calculate how much of the Currency Variance is driven by fluctuation in Headcount.
Creating Variance to Budget Rate Measure
You can create Variance to Budget Rate measure as follows −
VTB Rate:=([Budget Annualized CPH]/12-[Actual Annualized CPH]/12)*[Actual Total Head Count]
Creating Variance to Budget Volume Measure
You can create Variance to Budget Volume measure as follows −
VTB Volume:=[VTB Total Head Count]*[Budget Annualized CPH]/12
Analyzing Data with Variance to Budget Measures
Create a Power PivotTable as follows −
- Add the fields Fiscal Quarter and Fiscal Month from Date table to Rows.
- Add the measures Actual Annualized CPH, Budget Annualized CPH, VTB Rate, VTB Volume, VTB Sum to Values.
- Add the fields Fiscal Year from Date table and Sub Class from Accounts table to Filters.
- Select FY2016 in the Fiscal Year Filter.
- Select People in the Sub Class Filter.
- Filter Row Labels for Fiscal Quarter values FY2016-Q1 and FY2016-Q2.
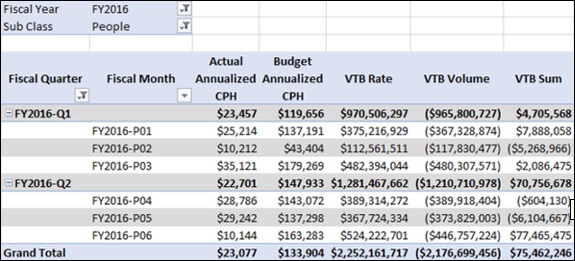
You can observe the following in the above PivotTable −
VTB Sum value shown is only for Sub Class – People.
For Fiscal Quarter FY2016-Q1, VTB Sum is $4,705,568, VTB Rate is $970,506,297, and VTB Volume is $-965,800,727.
VTB Rate measure calculates that $970,506,297 of the Variance to Budget (VTB Sum) is caused by the difference in Cost per Head, and $-965,800,727 is caused by the difference in Headcount.
If you add VTB Rate and VTB Volume, you will get $4,705,568, the same value as returned by VTB Sum for Sub Class People.
Similarly, for Fiscal Quarter FY2016-Q2, VTB Rate is $1,281,467,662, and VTB Volume is $-1,210,710,978. If you add VTB Rate and VTB Volume, you will get $70,756,678, which is the VTB Sum value shown in the PivotTable.
Creating Year-Over-Year Rate Measure
You can create Year-Over-Year Rate measure as follows −
YoY Rate:=([Actual Annualized CPH]/12-[Prior Year Actual Annualized CPH]/12)*[Actual Total Head Count]
Creating Year-Over-Year Volume Measure
You can create Year-Over-Year Volume measure as follows −
YoY Volume:=[YoY Actual Total Headcount]*[Prior Year Actual Annualized CPH]/12
Creating Variance to Forecast Rate Measure
You can create Variance to Forecast Rate measure as follows −
VTF Rate:=([Forecast Annualized CPH]/12-[Actual Annualized CPH]/12)*[Actual Total Head Count]
Creating Variance to Forecast Volume Measure
You can create Variance to Forecast Volume measure as follows −
VTF Volume:=[VTF Total Head Count]*[Forecast Annualized CPH]/12
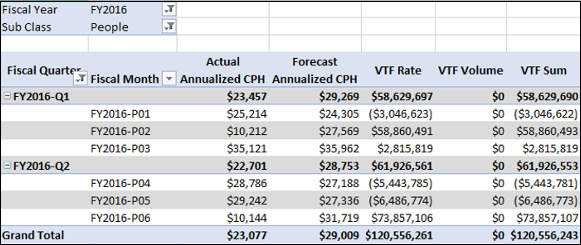
Analyzing Data with Variance to Forecast Measures
Create a Power PivotTable as follows −
Add the fields Fiscal Quarter and Fiscal Month from Date table to Rows.
Add the measures Actual Annualized CPH, Forecast Annualized CPH, VTF Rate, VTF Volume, VTF Sum to Values.
Add the fields Fiscal Year from Date table and Sub Class from Accounts table to Filters.
Select FY2016 in the Fiscal Year Filter.
Select People in the Sub Class Filter.
Filter Row Labels for Fiscal Quarter values FY2016-Q1 and FY2016-Q2.
Creating Forecast Variance to Budget Rate Measure
You can create Forecast Variance to Budget Rate measure as follows −
Forecast VTB Rate:=([Budget Annualized CPH]/12-[Forecast Annualized CPH]/12)*[Forecast Total Headcount]
Creating Forecast Variance to Budget Volume Measure
You can create Forecast Variance to Budget Volume measure as follows −
Forecast VTB Volume:=[Forecast VTB Total Head Count]*[Budget Annualized CPH]/12
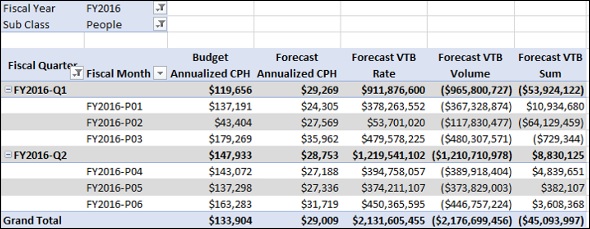
Analyzing Data with Forecast Variance to Budget Measures
Create a Power PivotTable as follows −
Add the fields Fiscal Quarter and Fiscal Month from Date table to Rows.
Add the measures Budget Annualized CPH, Forecast Annualized CPH, Forecast VTB Rate, Forecast VTB Volume, Forecast VTB Sum to Values.
Add the fields Fiscal Year from Date table and Sub Class from Accounts table to Filters.
Select FY2016 in the Fiscal Year Filter.
Select People in the Sub Class Filter.
Filter Row Labels for Fiscal Quarter values FY2016-Q1 and FY2016-Q2.