- Data Modeling with DAX Tutorial
- Home
- Data Modeling with DAX - Overview
- Data Modeling with DAX - Concepts
- Data Modeling Using Excel Power Pivot
- Loading Data into the Data Model
- Defining Data Types in the Data Model
- Understanding Data Tables
- Extending the Data Model
- Base Finance Measures & Analysis
- YoY Finance Measures & Analysis
- Variance Measures & Analysis
- Year-to-Date Measures & Analysis
- Quarter-to-Date Measures & Analysis
- Budget Measures & Analysis
- Forecast Measures & Analysis
- Count of Months Measures
- Ending Headcount Measures
- Average Headcount Measures
- Total Headcount Measures
- YoY Headcount Measures & Analysis
- Variance Headcount Measures
- Cost Per Headcount Measures & Analysis
- Rate Variance & Volume Variance
- Data Modeling with DAX Resources
- Quick Guide
- Useful Resources
- Discussion
Base Finance Measures and Analysis
You can create various measures in the data model to be used in any number of Power PivotTables. This forms the data modeling and analysis process with the data model using DAX.
As you have learnt earlier in the previous sections, data modeling and analysis is dependent on specific business and context. In this chapter, you will learn data modeling and analysis based on a sample Profit and Loss database to understand how to create the required measures and use them in various Power PivotTables.
You can apply the same method for data modeling and analysis for any business and context
Creating Measures Based on Finance Data
To create any financial report, you need to make calculations of amounts for a particular time period, organization, account, or geographical location. You also need to perform the headcount and cost per headcount calculations. In the data model, you can create base measures that can be reused in creating other measures. This is an effective way of data modeling with DAX.
In order to perform calculations for profit and loss data analysis, you can create measures such as sum, year-over-year, year-to-date, quarter-to-date, variance, headcount, cost per headcount, etc. You can use these measures in the Power PivotTables to analyze the data and report the analysis results.
In the following sections, you will learn how to create the base finance measures and analyze data with those measures. The measures are termed as base measures as they can be used in creating other financial measures. You will also learn how to create measures for the previous time periods and use them in the analysis.
Creating Base Finance Measures
In the finance data analysis, budget and forecast play a major role.
Budget
A budget is an estimate of a company’s revenues and expenses for a financial year. The budget is calculated at the beginning of a financial year keeping in view the company’s goals and targets. Budget measures need to be analyzed from time to time during the financial year, as the market conditions may change and the company may have to align its goals and targets to the current trends in the industry.
Forecast
A financial forecast is an estimate of a company's future financial outcomes by examining the company’s historical data of revenues and expenses. You can use financial forecasting for the following −
To determine how to allocate budget for a future period.
To track the expected performance of the company.
To take timely decisions to address shortfalls against the targets, or to maximize an emerging opportunity.
Actuals
To perform the budgeting and forecasting calculations, you require the actual revenue and expenses at any point in time.
You can create the following 3 base finance measures that can be used in creating other financial measures in the data mode −
- Budget Sum
- Actual Sum
- Forecast Sum
These measures are the aggregation sums over the columns – Budget, Actual, and Forecast in the Finance Data table.
Create the base finance measures as follows −
Budget Sum
Budget Sum:=SUM('Finance Data'[Budget])
Actual Sum
Actual Sum:=SUM('Finance Data'[Actual])
Forecast Sum
Forecast Sum:=SUM('Finance Data'[Forecast])
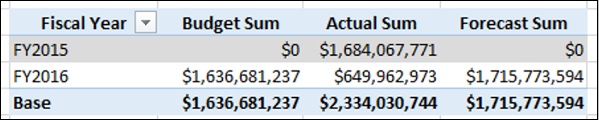
Analyzing Data with Base Finance Measures
With the base finance measures and the Date table, you can perform your analysis as follow −
- Create a Power PivotTable.
- Add the field Fiscal Year from the Date table to Rows.
- Add the measures Budget Sum, Actual Sum, and Forecast Sum (that appear as fields in the PivotTable Fields list) to Values.
Creating Finance Measures for Previous Periods
With the three base finance measures and the Date table, you can create other finance measures.
Suppose you want to compare the Actual Sum of a Quarter with the Actual Sum of previous Quarter. You can create the measure - Prior Quarter Actual Sum.
Prior Quarter Actual Sum:=CALCULATE([Actual Sum], DATEADD('Date'[Date],1,QUARTER))
Similarly, you can create the measure - Prior Year Actual Sum.
Prior Year Actual Sum:=CALCULATE([Actual Sum], DATEADD('Date'[Date],1,YEAR))
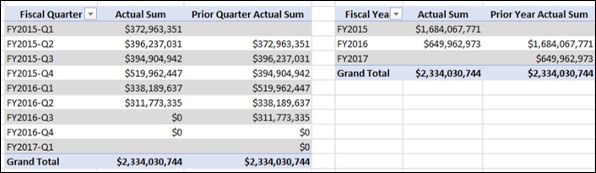
Analyzing Data with Finance Measures for Previous Periods
With the base measures, measures for previous periods and the Date table, you can perform your analysis as follows −
- Create a Power PivotTable.
- Add the field Fiscal Quarter from the Date table to Rows.
- Add the measures Actual Sum and Prior Quarter Actual Sum to Values.
- Create another Power PivotTable.
- Add the field Fiscal Year from the Date table to Rows.
- Add the measures Actual Sum and Prior Year Actual Sum to Values.