- Data Modeling with DAX Tutorial
- Home
- Data Modeling with DAX - Overview
- Data Modeling with DAX - Concepts
- Data Modeling Using Excel Power Pivot
- Loading Data into the Data Model
- Defining Data Types in the Data Model
- Understanding Data Tables
- Extending the Data Model
- Base Finance Measures & Analysis
- YoY Finance Measures & Analysis
- Variance Measures & Analysis
- Year-to-Date Measures & Analysis
- Quarter-to-Date Measures & Analysis
- Budget Measures & Analysis
- Forecast Measures & Analysis
- Count of Months Measures
- Ending Headcount Measures
- Average Headcount Measures
- Total Headcount Measures
- YoY Headcount Measures & Analysis
- Variance Headcount Measures
- Cost Per Headcount Measures & Analysis
- Rate Variance & Volume Variance
- Data Modeling with DAX Resources
- Quick Guide
- Useful Resources
- Discussion
Data Modeling Using Excel Power Pivot
Microsoft Excel Power Pivot is an excellent tool for data modeling and analysis.
Data model is the Power Pivot database.
DAX is the formula language that can be used to create metadata with the data in the data model by means of DAX formulas.
Power PivotTables in Excel created with the data and metadata in the data model enables you to analyze the data and present the results.
In this tutorial, you will learn data modeling with Power Pivot data model and DAX and data analysis with Power Pivot. If you are new to Power Pivot, please refer to the Excel Power Pivot tutorial.
You have learnt the data modeling process steps in the previous chapter - Data Modeling and Analysis Concepts. In this chapter, you will learn how to execute each of those steps with Power Pivot data model and DAX.
In the following sections, you will learn each of these process steps as applied to Power Pivot data model and how DAX is used.
Shaping the Data
In Excel Power Pivot, you can import data from various types of data sources and while importing, you can view and choose the tables and columns that you want to import.
Identify the data sources.
Find the data source types. For example, database or data service or any other data source.
Decide on what data is relevant in the current context.
Decide on the appropriate data types for the data. In Power Pivot data model, you can have only one data type for the entire column in a table.
Identify which of the tables are the fact tables and which are the dimensional tables.
Decide on the relevant logical relationships between the tables.
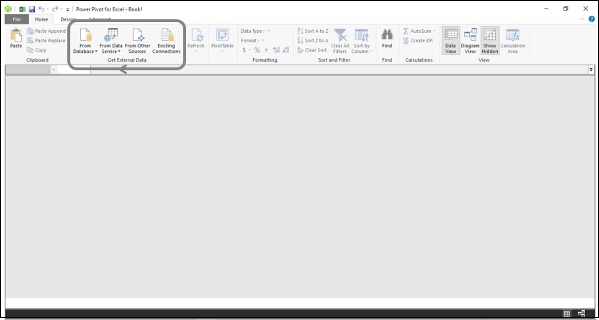
Loading Data into the Data Model
You can load data into the data model with several options provided in the Power Pivot window on the Ribbon. You can find these options in the group, Get External Data.
You will learn how to load data from an Access database into the data model in the chapter – Loading Data into the Data Model.
For illustration purposes, an Access database with Profit and Loss data is used.
Defining Data Types in the Data Model
The next step in the data modeling process in Power Pivot is defining data types of the columns in the tables that are loaded into the data model.
You will learn how to define data types of the columns in the tables in the chapter – Defining Data Types in the Data Model.
Creating Relationships Between the Tables
The next step in the data modeling process in Power Pivot is creating relationships between the tables in the data model.
You will learn how to create relationships between the tables in the chapter – Extending the Data Model.
Creating New Data Insights
In the data model, you can create metadata necessary for creating new data insights by −
- Creating Calculated Columns
- Creating Date Table
- Creating Measures
You can then analyze the data by creating dynamic Power PivotTables that are based on the columns in the tables and measures that appear as fields in the PivotTable Fields list.
Adding Calculated Columns
Calculated columns in a table are the columns that you add to a table by using DAX formulas.
You will learn how to add calculated columns in a table in the data model in the chapter - Extending the Data Model.
Creating Date Table
To use Time Intelligence Functions in DAX formulas to create metadata, you require a Date table. If you are new to Date tables, please refer to the chapter – Understanding Date Tables.
You will learn how to create a Date table in the data model in the chapter – Extending the Data Model.
Creating Measures
You can create various measures in the Data table by using the DAX functions and DAX formulas for different calculations as required for data analysis in the current context.
This is the crucial step of data modeling with DAX.
You will learn how to create the measures for various purposes of profit and loss analysis in the subsequent chapters.
Analyzing Data with Power PivotTables
You can create Power PivotTables for each of the facets of profit and loss analysis. As you learn how to create measures using DAX in the subsequent chapters, you will also learn how to analyze data with these measures using Power PivotTables.