- Data Modeling with DAX Tutorial
- Home
- Data Modeling with DAX - Overview
- Data Modeling with DAX - Concepts
- Data Modeling Using Excel Power Pivot
- Loading Data into the Data Model
- Defining Data Types in the Data Model
- Understanding Data Tables
- Extending the Data Model
- Base Finance Measures & Analysis
- YoY Finance Measures & Analysis
- Variance Measures & Analysis
- Year-to-Date Measures & Analysis
- Quarter-to-Date Measures & Analysis
- Budget Measures & Analysis
- Forecast Measures & Analysis
- Count of Months Measures
- Ending Headcount Measures
- Average Headcount Measures
- Total Headcount Measures
- YoY Headcount Measures & Analysis
- Variance Headcount Measures
- Cost Per Headcount Measures & Analysis
- Rate Variance & Volume Variance
- Data Modeling with DAX Resources
- Quick Guide
- Useful Resources
- Discussion
Extending the Data Model
In this chapter, you will learn how to extend the data model created in the previous chapters. Extending a data model includes −
- Addition of tables
- Addition of calculated columns in an existing table
- Creation of measures in an existing table
Of these, creating the measures is crucial, as it involves providing new data insights in the data model that will enable those using the data model avoid rework and also save time while analyzing the data and decision making.
As Profit and Loss Analysis involves working with time periods and you will be using DAX Time Intelligence functions, you require a Date table in the data model.
If you are new to Date tables, go through the chapter – Understanding Date Tables.
You can extend the data model as follows −
To create a relationship between the data table, i.e. Finance Data table and the Date table, you need to create a calculated column Date in the Finance Data table.
To perform different types of calculations, you need to create relationships between the data table - Finance Data and the lookup tables – Accounts and Geography Locn.
You need to create various measures that help you perform several calculations and carry out the required analysis.
These steps essentially constitute the data modeling steps for Profit and Loss Analysis using the data model. However, this is the sequence of steps for any type of data analysis that you want to perform with Power Pivot data model.
Further, you will learn how to create the measures and how to use them in the Power PivotTables in the subsequent chapters. This will give you sufficient understanding of data modeling with DAX and data analysis with Power PivotTables.
Adding a Date Table to the Data Model
Create a Date table for the time periods spanning the fiscal years as follows −
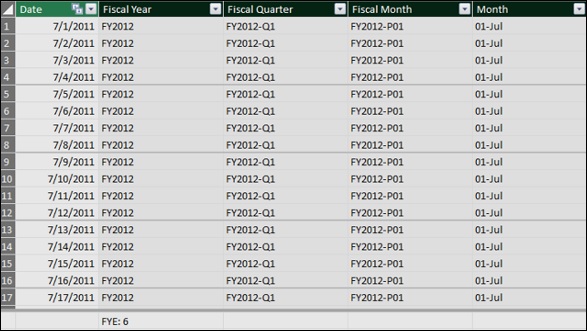
Create a table with a single column with header – Date and contiguous dates ranging from 7/1/2011 to 6/30/2018 in a new Excel worksheet.
Copy the table from Excel and paste it into the Power Pivot window. This will create a new table in the Power Pivot data model.
Name the table as Date.
Ensure that the Date column in the Date table is of data type - Date (DateTime).
Next, you need to add the calculated columns – Fiscal Year, Fiscal Quarter, Fiscal Month and Month to the Date table as follows −
Fiscal Year
Suppose the fiscal year end is June 30th. Then, a fiscal year spans from 1st July to 30th June. For example, the period July 1st, 2011 (7/1/2011) to June 30th, 2012 (6/30/2012) will be the fiscal year 2012.
In the Date table, suppose you want to represent the same as FY2012.
You need to first extract the financial year part of the Date and append it with FY.
For the dates in the months July 2011 to December 2011, the financial year is 1+2011.
For the dates in the months January 2012 to June 2012, the financial year is 0+2012.
To generalize, if the Month of Financial Year End is FYE, do the following −
Integer Part of ((Month – 1)/FYE) + Year
Next, take the rightmost 4 characters to obtain the Financial Year.
In DAX, you can represent the same as −
RIGHT(INT((MONTH('Date'[Date])-1)/'Date'[FYE])+YEAR('Date'[Date]),4)
Add the calculated column Fiscal Year in the Date table with the DAX formula −
="FY"&RIGHT(INT((MONTH('Date'[Date])-1)/'Date'[FYE])+YEAR('Date'[Date]),4)
Fiscal Quarter
If FYE represents the month of financial year end, the financial quarter is obtained as
Integer Part of ((Remainder of ((Month+FYE-1)/12) + 3)/3)
In DAX, you can represent the same as −
INT((MOD(MONTH('Date'[Date])+'Date'[FYE]-1,12)+3)/3)
Add the calculated column Fiscal Quarter in the Date table with the DAX formula −
='Date'[FiscalYear]&"-Q"&FORMAT( INT((MOD(MONTH('Date'[Date]) + 'Date'[FYE]-1,12) + 3)/3), "0")
Fiscal Month
If FYE represents the financial year end, the financial month period is obtained as
(Remainder of (Month+FYE-1)/12) + 1
In DAX, you can represent the same as −
MOD(MONTH('Date'[Date])+'Date'[FYE]-1,12)+1
Add the calculated column Fiscal Month in the Date table with the DAX formula −
='Date'[Fiscal Year]&"-P" & FORMAT(MOD(MONTH([Date])+[FYE]-1,12)+1,"00")
Month
Finally, add the calculated column Month that represents the month number in a financial year as follows −
=FORMAT(MOD(MONTH([Date])+[FYE]-1,12)+1,"00") & "-" & FORMAT([Date],"mmm")
The resulting Date table looks like the following screenshot.
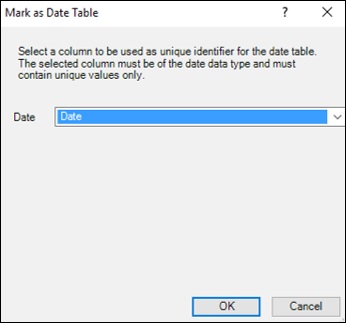
Mark the table – Date as Date Table with the column - Date as the column with unique values as shown in the following screenshot.
Adding Calculated Columns
To create a relationship between the Finance Data table and the Date table, you require a column of Date values in the Finance Data table.
Add a calculated column Date in the Finance Data table with the DAX formula −
= DATEVALUE ('Finance Data'[Fiscal Month])
Defining Relationships Between Tables in the Data Model
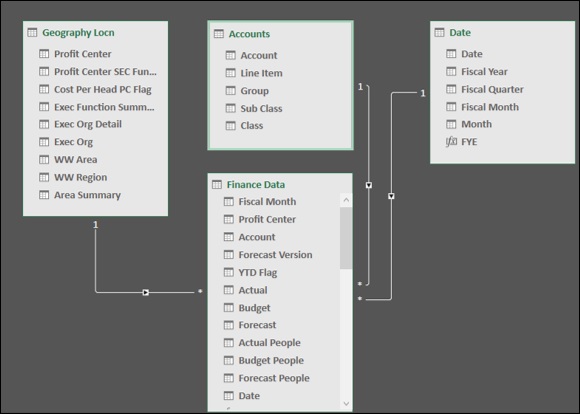
You have the following tables in the data model −
- Data table - Finance Data
- Lookup tables - Accounts and Geography Locn
- Date table - Date
To define Relationships between the tables in the data model, following are the steps −
View the tables in the Diagram View of the Power Pivot.
Create the following relationships between the tables −
Relationship between Finance Data table and Accounts table with the column Account.
Relationship between Finance Data table and Geography Locn table with the column Profit Center.
Relationship between Finance Data table and Date table with the column Date.
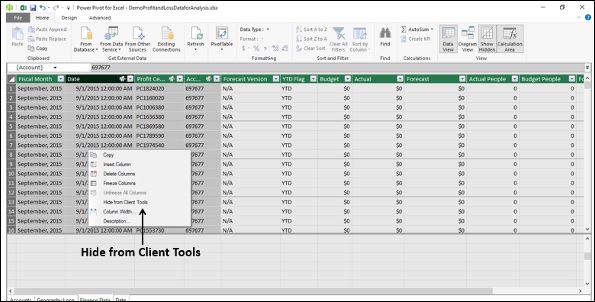
Hiding Columns from Client Tools
If there are any columns in a data table that you won’t be using as fields in any PivotTable, you can hide them in the data model. Then, they will not be visible in the PivotTable Fields list.
In the Finance Data table, you have 4 columns – Fiscal Month, Date, Account and Profit Center that you won’t be using as fields in any PivotTable. Hence, you can hide them so that they do not appear in the PivotTable Fields list.
Select the columns - Fiscal Month, Date, Account, and Profit Center in the Finance Data table.
Right-click and select Hide from Client Tools in the dropdown list.
Creating Measures in the Tables
You are all set for data modeling and analysis with DAX using the data model and Power PivotTables.
In the subsequent chapters, you will learn how to create measures and how to use them in Power PivotTables. You will create all the measures in the data table, i.e. Finance Data table.
You will create measures using DAX formulas in the data table – Finance Data, which you can use in any number of PivotTables for the data analysis. The measures are essentially the metadata. Creating measures in the data table is part of data modeling and summarizing them in the Power PivotTables is part of data analysis.