- Data Modeling with DAX Tutorial
- Home
- Data Modeling with DAX - Overview
- Data Modeling with DAX - Concepts
- Data Modeling Using Excel Power Pivot
- Loading Data into the Data Model
- Defining Data Types in the Data Model
- Understanding Data Tables
- Extending the Data Model
- Base Finance Measures & Analysis
- YoY Finance Measures & Analysis
- Variance Measures & Analysis
- Year-to-Date Measures & Analysis
- Quarter-to-Date Measures & Analysis
- Budget Measures & Analysis
- Forecast Measures & Analysis
- Count of Months Measures
- Ending Headcount Measures
- Average Headcount Measures
- Total Headcount Measures
- YoY Headcount Measures & Analysis
- Variance Headcount Measures
- Cost Per Headcount Measures & Analysis
- Rate Variance & Volume Variance
- Data Modeling with DAX Resources
- Quick Guide
- Useful Resources
- Discussion
Understanding Data Tables
Data Analysis involves browsing data over time and making calculations across time periods. For example, you might have to compare the current year’s profits with the previous year’s profits. Similarly, you might have to forecast the growth and profits in the coming years. For these, you need to use grouping and aggregations over a period of time.
DAX provides several Time Intelligence functions that help you perform most of such calculations. However, these DAX functions require a Date table for usage with the other tables in the data model.
You can either import a Date table along with other data from a data source or you can create a Date table by yourself in the data model.
In this chapter, you will understand different aspects of Date tables. If you are conversant with Date tables in the Power Pivot data model, you can skip this chapter and proceed with the subsequent chapters. Otherwise, you can understand the Date tables in the Power Pivot data model.
What is a Date Table?
A Date Table is a table in a data model, with at least one column of contiguous dates across a required duration. It can have additional columns representing different time periods. However, what is necessary is the column of contiguous dates, as required by the DAX Time Intelligence functions.
For example,
A Date table can have columns such as Date, Fiscal Month, Fiscal Quarter, and Fiscal Year.
A Date table can have columns such as Date, Month, Quarter, and Year.
Date Table with Contiguous Dates
Suppose you are required to make calculations in the range of a calendar year. Then, the Date table must have at least one column with a contiguous set of dates, including all the dates in that specific calendar year.
For example, suppose the data you want to browse has dates from April 1st, 2014 through November 30th, 2016.
If you have to report on a calendar year, you need a Date table with a column – Date, which contains all the dates from January 1st, 2014 to December 31st, 2016 in a sequence.
If you have to report on a fiscal year, and your fiscal year end is 30th June, you need a Date table with a column – Date, which contains all the dates from July 1st, 2013 to June 30th, 2017 in a sequence.
If you have to report on both calendar and fiscal years, then you can have a single Date table spanning the required range of dates.
Your Date table must contain all of the days for the range of every year in the given duration. Thus, you will get contiguous dates within that period of time.
If you regularly refresh your data with new data, you will have the end date extended by a year or two, so that you do not have to update your Date table often.
A Date table looks like the following screenshot.
Adding a Date Table to the Data Model
You can add a Date table to the data model in any of the following ways −
Importing from a relational database, or any other data source.
Creating a Date table in Excel and then copying or linking to a new table in Power Pivot.
Importing from Microsoft Azure Marketplace.
Creating a Date Table in Excel and Copying to the Data Model
Creating a Date table in Excel and copying to the data model is the easiest and most flexible way of creating a Data table in the data model.
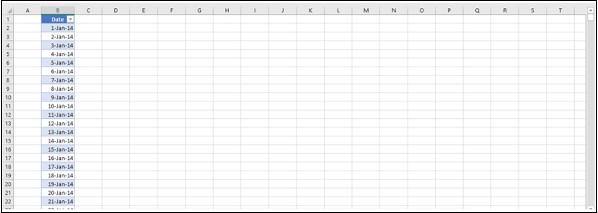
Open a new worksheet in Excel.
Type – Date in the first row of a column.
Type the first date in the date range that you want to create in the second row in the same column.
Select the cell, click the fill handle and drag it down to create a column of contiguous dates in the required date range.
For example, type 1/1/2014, click the fill handle and drag down to fill the contiguous dates up to 31/12/2016.
- Click the Date column.
- Click the INSERT tab on the Ribbon.
- Click Table.
- Verify the table range.
- Click OK.
The table of a single column of dates is ready in Excel.
- Select the table.
- Click Copy on the Ribbon.
- Click the Power Pivot window.
- Click Paste on the Ribbon.
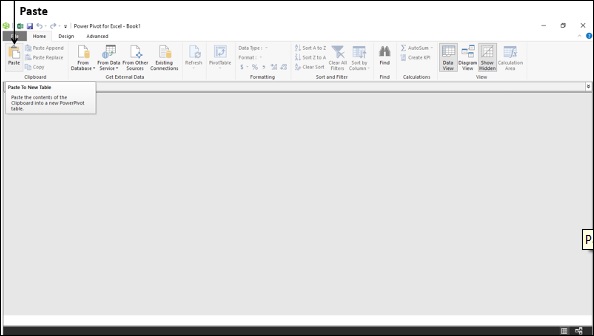
This will add the contents of the clipboard to a new table in the data model. Hence, you can use the same method to create a Date table in an existing data model also.
Paste preview dialog box appears as shown in the following screenshot.
- Type Date in the Table Name box.
- Preview the data.
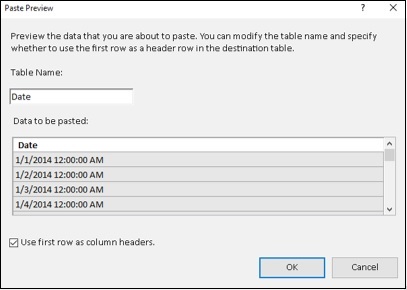
- Check the box – Use first row as column headers.
- Click OK.
This copies the contents of the clipboard to a new table in the data model.
Now, you have a Date table in the data model with a single column of contiguous dates. The header of the column is Date as you had given in the Excel table.
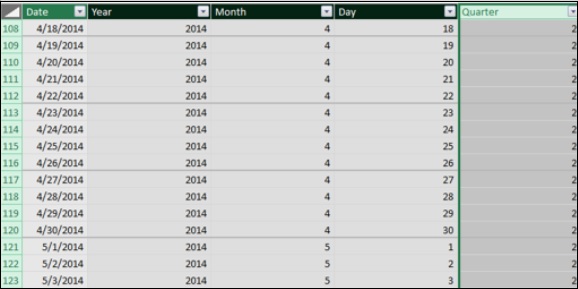
Adding New Date Columns to the Date Table
Next, you can add calculated columns to the Date table as per the requirement for your calculations.
For example, you can add columns – Day, Month, Year, and Quarter as follows −
- Day
=DAY('Date'[Date])
- Month
=MONTH('Date'[Date])
- Year
=YEAR('Date'[Date])
- Quarter
=CONCATENATE ("QTR ", INT (('Date'[Month]+2)/3))
The resulting Date table in the data model looks like the following screenshot.
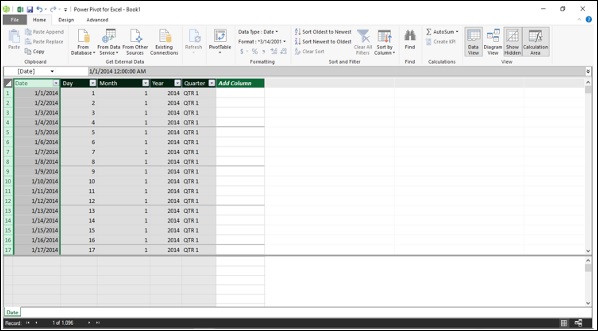
Thus, you can add any number of calculated columns to the Date table. What is important and is required is that the Date table must have a column of contiguous dates that spans the duration of time over which you perform calculations.
Creating a Date Table for a Calendar Year
A calendar year typically includes the dates from 1st January to 31st December of a year and also includes the holidays marked for that particular year. When you perform calculations, you might have to take into account only the working days, excluding weekends and holidays.
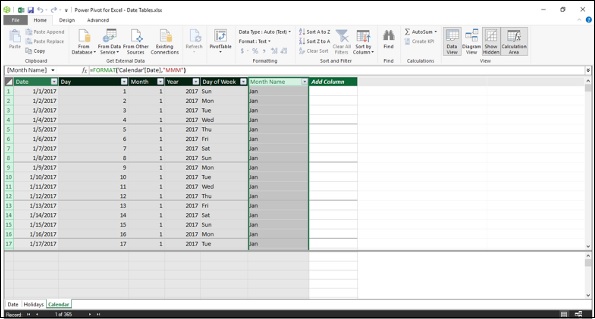
Suppose, you want to create a Date table for the calendar year 2017.
Create an Excel table with a column Date, consisting of contiguous dates from 1st January 2017 to 31st December 2017. (Refer to the previous section to know how to do this.)
Copy the Excel table and paste it into a new table in the data model. (Refer to the previous section to know how to do this.)
Name the table as Calendar.
Add the following calculated columns −
Day =DAY('Calendar'[Date])
Month =MONTH('Calendar'[Date])
Year =YEAR('Calendar'[Date])
Day of Week =FORMAT('Calendar'[Date],"DDD")
Month Name =FORMAT('Calendar'[Date],"MMM")
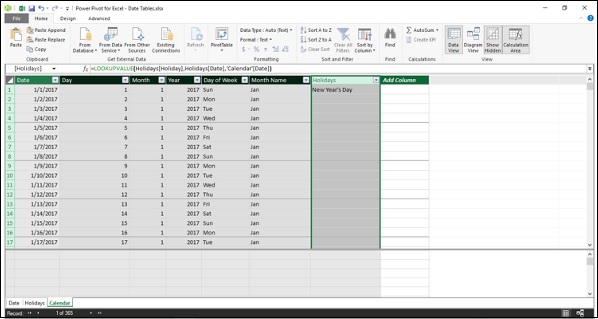
Adding Holidays to the Calendar Table
Add holidays to the Calendar Table as follows −
Get the list of declared holidays for the year.
For example, for the US, you can get the list of holidays for any required year from the following link http://www.calendar-365.com/.
Copy and paste them into an Excel worksheet.
Copy the Excel table and paste it into a new table in the data model.
Name the table as Holidays.
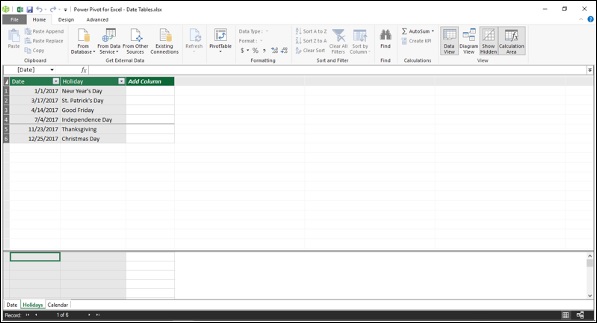
Next, you can add a calculated column of holidays to the Calendar table using DAX LOOKUPVALUE function.
=LOOKUPVALUE(Holidays[Holiday],Holidays[Date],'Calendar'[Date])
DAX LOOKUPVALUE function searches the third parameter, i.e. Calendar[Date] in the second parameter, i.e. Holidays[Date] and returns the first parameter, i.e. Holidays[Holiday] if there is a match. The result will look like what is shown in the following screenshot.
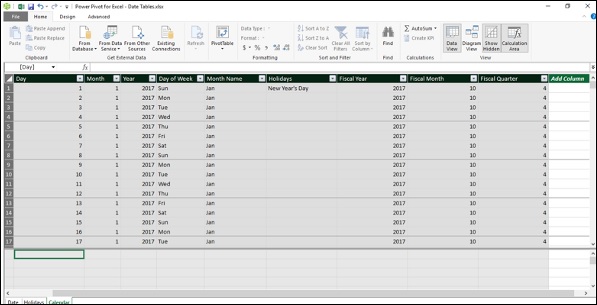
Adding Columns to a Fiscal Year
A fiscal year typically includes the dates from 1st of the month after the fiscal year end to the next fiscal year end. For example, if the fiscal year end is 31st March, then the fiscal year ranges from 1st April to 31st March.
You can include the fiscal time periods in the calendar table using the DAX formulas −
Add a measure for FYE
FYE:=3
Add the following calculated columns −
Fiscal Year
=IF('Calendar'[Month]<='Calendar'[FYE],'Calendar'[Year],'Calendar'[Year]+1)
Fiscal Month
=IF('Calendar'[Month]<='Calendar'[FYE],12-'Calendar'[FYE]+'Calendar'[Month],'Calendar'[Month]-'Calendar'[FYE] )
Fiscal Quarter
=INT(('Calendar'[Fiscal Month]+2)/3)
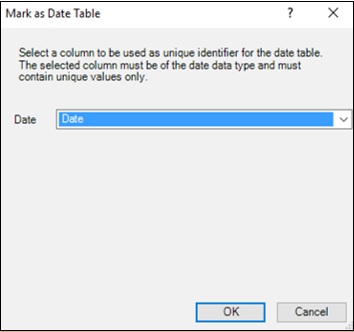
Setting the Date Table Property
When you use DAX Time Intelligence functions such as TOTALYTD, PREVIOUSMONTH, and DATESBETWEEN, they require metadata to work correctly. Date Table Property sets such metadata.
To set the Date Table property −
- Select Calendar table in the Power Pivot window.
- Click the Design tab on the Ribbon.
- Click Mark as Date Table in the Calendars group.
- Click Mark as Date Table in the dropdown list.
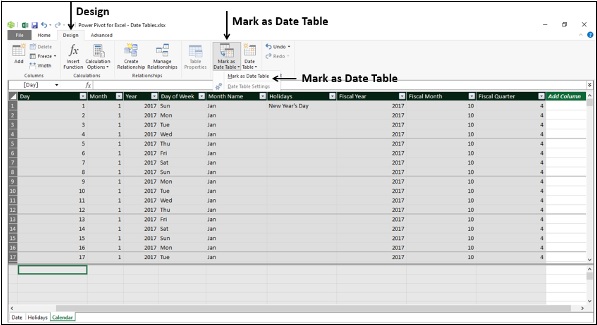
Mark as Date Table dialog box appears. Select the Date column in the Calendar table. This has to be the column of Date data type and has to have unique values. Click OK.