
Article Categories
- All Categories
-
 Data Structure
-
 Networking
-
 RDBMS
RDBMS
-
 Operating System
-
 Java
Java
-
 MS Excel
-
 iOS
iOS
-
 HTML
HTML
-
 CSS
CSS
-
 Android
-
 Python
-
 C Programming
-
 C++
C++
-
 C#
C#
-
 MongoDB
-
 MySQL
MySQL
-
 Javascript
-
 PHP
PHP
-
 Economics & Finance
What is Kicker Pattern and how does It work?
When a kicker pattern occurs, it is a two-bar candlestick pattern that forecasts a shift in the direction of an asset's price trend. Kicker patterns are common in the financial markets. Over the course of two candlesticks, this pattern is marked by a dramatic reversal in the price movement. Investors use it to identify which group of market players is in command of the direction of the market's movement.
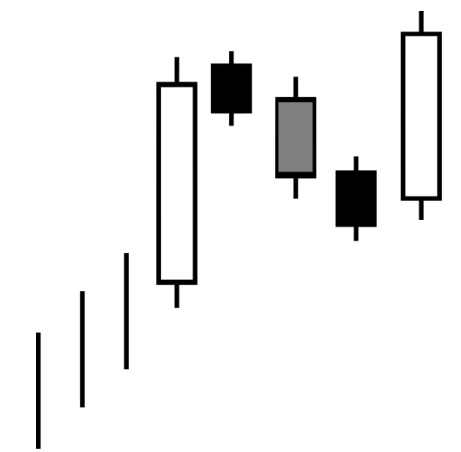
Kicker Pattern - Example
Key Points Briefly −
Over the course of two candlesticks, this pattern is marked by a dramatic reversal in the price movement.
Kicker patterns are used by traders to identify which group of market players is in command of the direction of the market.
Following the revelation of important information about an organization, industry, or economy, the pattern indicates a significant shift in investors' views about the security in question.
Kicker patterns may be bullish or bearish depending on their placement.
Contrast the Bullish Kicker Pattern with the Bearish Kicker Pattern.
Kicker patterns are described in the realm of technical analysis as patterns that anticipate changes in the price of an asset and may be classified into two types.
Bullish Kicker Patterns (also known as kicker patterns)
A bullish kicker pattern suggests that the stock market may be on the verge of rising in value.Bullish Kicker Patterns are a kind of pattern that occurs when a bullish trend is established.
Bullish kicker patterns are widely regarded as one of the most effective and important technical analysis techniques available to traders, according to the popular opinion.The main disadvantage of the bullish kicker pattern is that it is very uncommon and only occurs in a limited number of specific circumstances and occurrences.
Bearish Kicker Patterns
A bearish kicker pattern is the polar opposite of a bullish kicker pattern in that it suggests that the stock prices may be on the fall. An example of such a configuration is shown below −
Bearish kicker patterns begin with a white (bullish) candlestick, which is subsequently followed by a black (bearish) candlestick that opens below the white candlestick, creating a huge downward gap, as shown.
The following are some of the characteristics of a bull market −
Shareholders purchasing more stock − If stock prices are increasing and investors are certain that they will continue to rise, they will acquire additional shares.
Unemployment rates are reducing − As unemployment rates decline, the average salary rises, causing businesses to fight for employees and people to seek for higher-paying positions.
Firms looking for expansion − With customers spending generously, firms look forward to the future and begin to turn their profits into investments to expand their business presence.
Market in a Bearish Spiral
A bear market occurs when the market plunges, and obviously becomes the opposite of bull market.

459 Views
