
Article Categories
- All Categories
-
 Data Structure
-
 Networking
-
 RDBMS
RDBMS
-
 Operating System
-
 Java
Java
-
 MS Excel
-
 iOS
iOS
-
 HTML
HTML
-
 CSS
CSS
-
 Android
-
 Python
-
 C Programming
-
 C++
C++
-
 C#
C#
-
 MongoDB
-
 MySQL
MySQL
-
 Javascript
-
 PHP
PHP
-
 Economics & Finance
What Is an Isoquant Curve and How Does It Work?
The isoquant curve is characterized by a concave shaped line graph that measures all the components of inputs, that contribute to a specific amount of output production. They are usually employed in the study of Microeconomics as a measure to evaluate the most commonly studied inputs of capital and labor, and the impact they have on manufacturing.
An example illustration of an isoquant curve below −
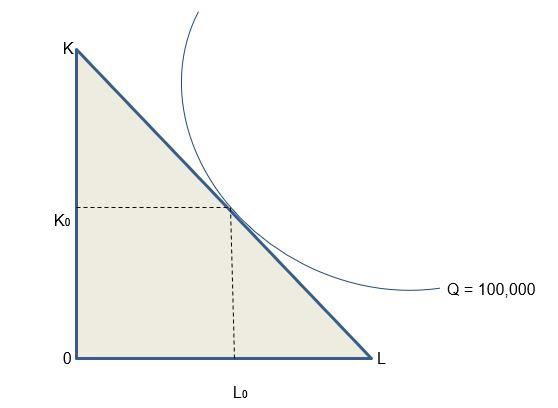
The isoquant curve aids corporations and enterprises in making modifications to inputs in order to optimize output and, therefore, profit.
Companies and enterprises use the isoquant curve to make modifications in inputs to maximize manufacturing, and thus enhance growth margins.
Key Points Briefly
When plotted on a graph, an isoquant curve represents several permutations of two inputs that result in the same amount of output as one another.
Isoquant curves usually depicts the interaction of capital and labour, as well as the technical trade-off that exists.
It helps companies and businesses to make amendments to their manufacturing operations, and consequently minimising costs of production.
How do you calculate an Isoquant?
$$MRTS(L,K)=\frac{\Delta\:K}{\Delta\:L}=\frac{MP_{L}}{MP_{K}}$$
Where −
K = Capital
L = Labour
MP =Marginal products of each input
$\frac{\Delta\:K}{\Delta\:L}$= Amount of capital that can be reduced
When the labour is increased.
What are the Features of an Isoquant Curve?
Property 1 − The isoquant curves are characterized by their downward slope or negative slope. When it comes to technical substitution, this quality is in accordance with the Marginal Rate of Technical Substitution concept (MRTS). As an example, a corporation may be able to maintain the same level of production even if its capital inputs grow and its labor inputs decline.
Property 2 − An isoquant curve is convex to its origin due to the MRTS phenomenon, which demonstrates that variables of manufacturing may be replaced for one another in the manufacturing process.
Property 3 − Isoquant curves are incapable of being tangent or overlapping with one other. Moreover, intersecting curves are wrong and yield wrong results, since a common factor combination on each of the curves would result in the same output.
Property 4 − Isoquant curves in the upper regions of the chart provide greater outputs than those in the lower regions of the chart. This is due to the fact that factors of production are more intensively used toward the top of the curve.
Property 5 − The isoquant curve curve should not cross either the X-axis or the Yaxis of the graph in any way as the rate of technical substitution will be rendered null and invalid.
Property 6 − Isoquant curve doesn’t have to be parallel to one other, however there are variations that could be observed.
Property 7 − Isoquant curves have an oval form, which allows enterprises to decide which elements of production are the most efficient.

2K+ Views
