- SAP Design Studio - Home
- SAP Design Studio - Overview
- SAP Design Studio - Key Features
- SAP Design Studio - How To Logon
- SAP Design Studio - Navigation
- Create an Application
- Add Data Source
- HANA Connectivity
- Setting Up Bookmarks
- Working With Data Sources
- Connect to a UDS
- SAP Design Studio - Exporting Data
- HANA Mode Interactive
- Working With Info Charts
- Working With Filters
- SAP Design Studio - Geomap
- Exporting an Application
- Exporting as Templates
- Visualization Templates
- Custom Dashboards
- Refresh a Document
SAP Design Studio - Quick Guide
SAP Design Studio - Overview
SAP BusinessObjects Design Studio can be defined as an Application Development Tool for creating advanced level Dashboards using SAP BW, HANA and Universe Data Sources. These interactive dashboards can be accessed on mobile devices like iPad, mobile phones, and tablets.
To create applications and advanced Dashboards you dont need any knowledge of HTML and UI5 programming and you can subset of Java scripts and bookmarks for application development.
SAP Design Studio can be used with following data sources −
- SAP Business Warehouse (BW)
- SAP HANA
- SAP BusinessObjects BI Platform
It allows you to design applications and enter data manually in Crosstabs or you can also add data using planning objects while using SAP BW as the backend system. Applications developed in Design Studio can have real time connection to SAP HANA or the Business Warehouse System.
Using SAP BusinessObjects Design Studio SDK, you can also add 3rd party custom components in your application. These components can get data from different data sources to create interactive visualizations. Apart from this, SDK components can also act as data source for other SDK components.
Design Studio Terminology
Design Studio allows application developers to create and edit applications that are saved in the XML format. These applications contain interactive dashboards and advance data visualizations by using charts, crosstabs, etc. and alias of data source.
Data Source and Binding
You can create applications using different components like charts, crosstabs and data source alias. A Data source alias is defined as an instance of SAP BW or HANA data source. If you want to see the list of components that are used in an application, you can check this in outline view of Design tool.
Data Binding
To use different components like charts, crosstabs you need to bind the data from data source alias to these components. Data binding defines the simple mapping of data to components in application. When data in data alias is changed, Design Studio automatically updates all the components that are bound to that data alias.
To see the data binding relationship between components and data sources, you can go to the outline view.
In SAP BusinessObjects Design Studio, you can create applications that allow you to interact with data by applying different components like filters, drill down to dimensions and aggregated data detailed analysis, etc.
To enable users to interact with data, you need to add UI components in the application.
Example
You can create a Radio button on top of the chart to visualize the data for different regions in a sales analysis.
You can set an event with each button in a user interactive application. To see the list of all available components, you can navigate to Properties view of the Design Studio. All the events are defined in the script editor where you can mention the action to take place when an application user triggers a specific event.
The scripting language used in the script editor is a subset of Java script and you can define multiple sequences of API methods call.
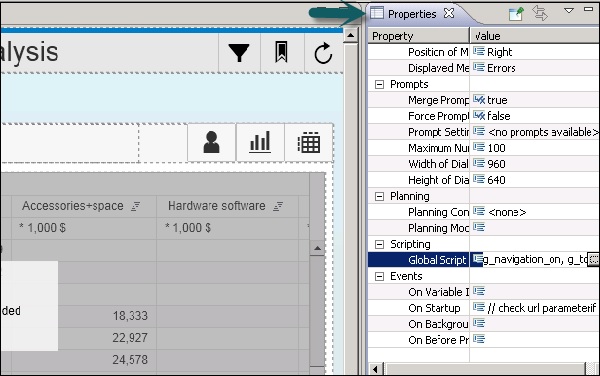
Apart from scripting properties, there are various other properties that are defined in the Properties view. Some of the properties are common for all the components however a few are specific.
Example
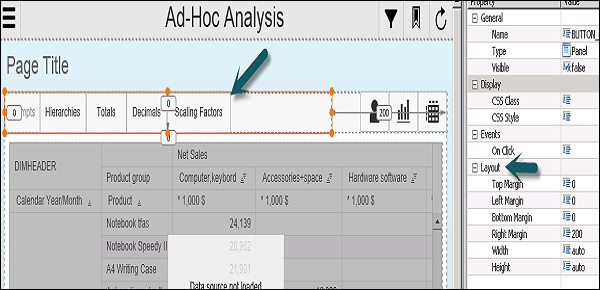
Display properties define theme applied, position of message, message window, etc. and other properties of application. Layout property defines the positioning of the following components in an application −
- Top Margin
- Left Margin
- Right Margin
- Width
- Height
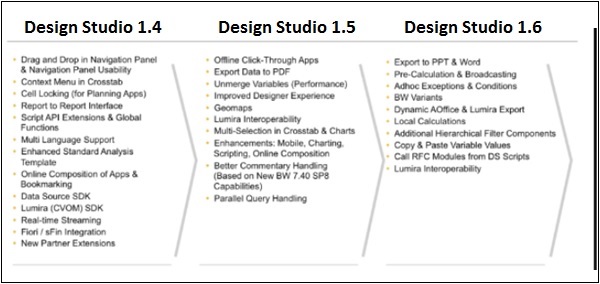
Roadmap of SAP Design Studio
Here is the roadmap of the SAP Design Studio along with its release month and year.
- SAP BusinessObjects Design Studio 1.4 Released Date − Nov, 2014
- SAP BusinessObjects Design Studio 1.5 Released Date − May, 2015
- SAP BusinessObjects Design Studio 1.6 Released Date − Dec, 2015
SAP Design Studio - Key Features
As per the Design Studio roadmap strategy, the following are the key features that are covered in the latest version of the SAP BusinessObjects Design Studio 1.6 SP2.
Features for the End-Users
- Resizable, movable dialogs
- Display scaling factors in Info Chart
- Waterfall Info Charts
Features for the Analyst
- Ad hoc currency conversion
- Build virtual hierarchy of stacked dimensions
- Cascading Filter for Universe and CSV as Data
- Source
Features for the Designer, Developer, and Administrators
New standard components, e.g. Dialog, Filter Bar, Link, MultiLine Text Input, Switch, Progress Bar (SAP Fiori Library).
Info Chart Enhancements
Initial View Editor − Simple Calculations
Designer UI Enhancement − Compact Palette View
Resizable, movable Dialog
- New component available in SAP Fiori library
- Container component
- Free defined buttons for dialog footer
- Movable, resizable and full screen maintained in property sheet
Displaying Scaling Factors in Info Chart
- Showing data label including scaling factor with Tooltips.
Waterfall Info Chart
- New chart type
- Semantic coloring (e.g. Negative, Positive and Total)
- Configurable connection line
- Set as Total possible in design time.
Adhoc Currency Conversion
- New API for opening currency conversion dialog
- Conversion based on target currency and conversion type defined in SAP BW backend
- Can be added as custom entry in context menu
Filter Bar
- New component in SAP Fiori library
- End user can select dimension filters to show and set filter value
- Toggle button to show or hide filter bar
- Defining On Toggle event via API
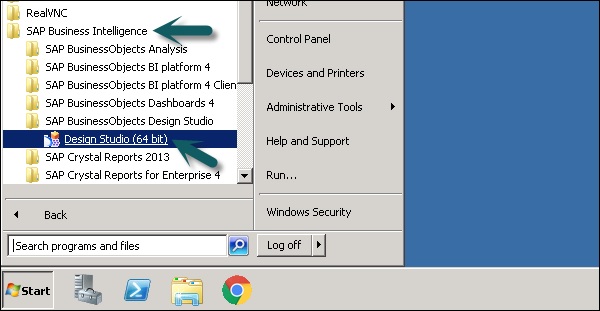
SAP Design Studio - How to Logon
To open SAP BusinessObjects Design Studio, go to Start → All Programs → SAP Business Intelligence → SAP BusinessObjects Design Studio → Design Studio
In the Logon to SAP BusinessObjects BI Platform dialog box, type in your user name and password for the BI Platform. When Design Studio is launched first time, you need to enter the following details −
- Host Name
- Port into the Web Service URL
- Select the authentication.
- Click OK
When you want to use SAP BW as backend, in the logon to SAP NetWeaver dialog box, select BW system from the drop down list and enter the system details and the username as well as the password.
In a similar way, you can also logon to SAP HANA dialog box, enter username and password for the HANA system.
SAP Design Studio - Navigation
In this chapter, we will discuss regarding the various navigation functions when you open SAP Business Objects Design Studio.
Welcome Page
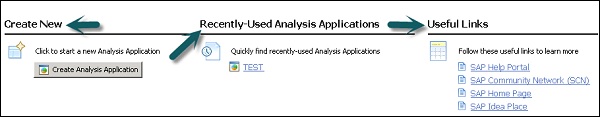
When you open SAP BusinessObjects Design Studio, you land on the welcome page first. It consists of different sections, which are as follows −
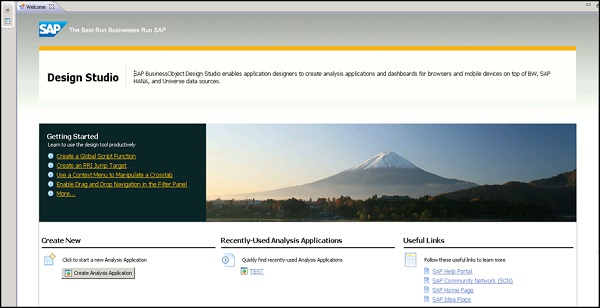
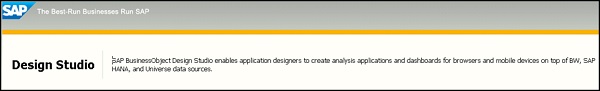
Design Studio at the Top
SAP BusinessObjects Design Studio enables application designers to create analysis applications and dashboards for browsers and mobile devices on top of BW, SAP HANA, and Universe data sources.
Getting Started
This section allows you to access the help material to make you familiar with the tool and you can go through the video which will help you in how to document the tutorial guide to learn key features, concepts, and tasks of the Design Studio.
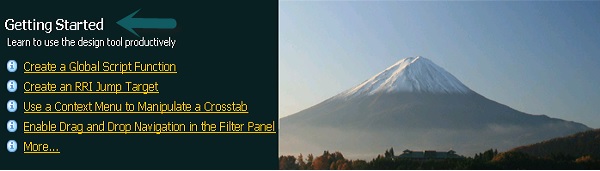
Other features include −
Create New − This can be used to create a new analysis application.
Recently Used − This can be used to access recently opened analysis applications in Design Studio.
Useful Links
This allows you to find useful information and access SAP Community Network, SAP Idea Place and SAP Help Portal.
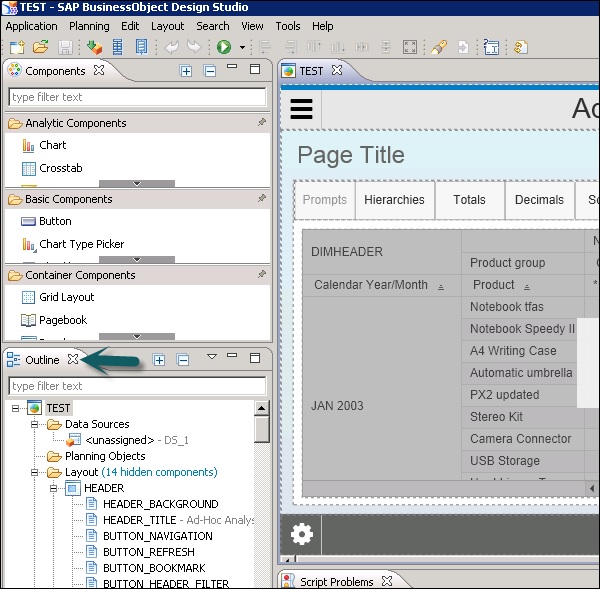
Design Studio Navigation Views
When you start to create a new analysis application, you can see the following views in the Design Studio user interface −
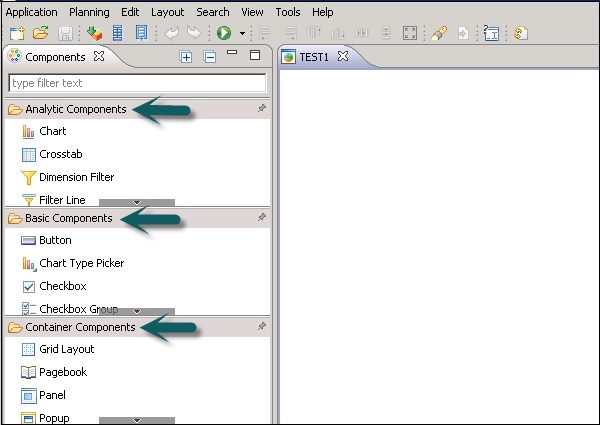
Components View
This view provides you with a list of all the components that you can use to create a new analysis application. You can drag and drop different components in the layout to create the content of that application.
These components are grouped in different folders −
Analytic Components − You can use different analytic components like charts and cross tabs.
Basic Components − This folder contains basic components like check box, date field, image, input field, list box, etc.
Container Component − This allows you to group and structure the content of an application.
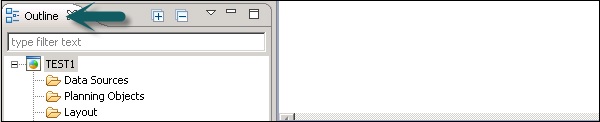
Outline View
This view gives you a hierarchical structure of all objects in the currently active application. It consists of all the data sources and all the UI components.
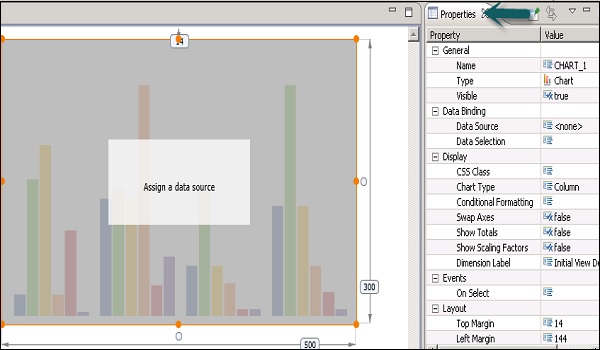
Properties View
This shows the properties of the currently active object in an analysis application. It displays the property of the currently selected object in an outline view tree node or in the component editor.
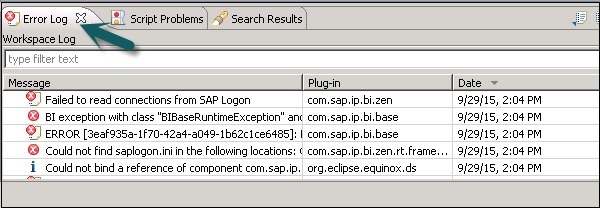
Error Log View
This is used to display general errors related to system or messages for script validation.
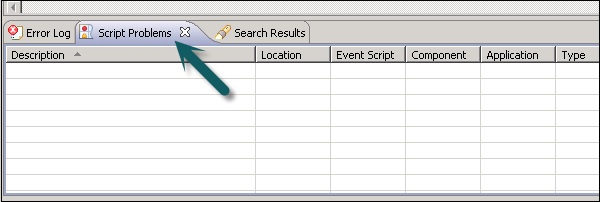
Problems View
This is used to display the problem in scripting during the design time, when you save the application.
Layout Editor
For each application, an editor is opened that contains components for the application. When you make any changes to a component in editor area, it automatically reflects these changes to other views in the Design tool.
If you resize a component in the editor, it automatically changes the layout values under the Properties view of the Design tool. The same applies to the Outline and other views.
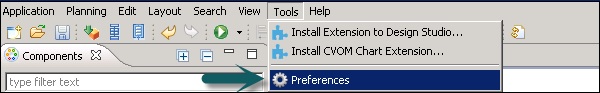
Maintaining Settings in the Design Tool
This is used to define the settings for a Design tool in the Preferences tab. To open the Preferences dialog box, go to Tool → Preferences → Application Design.
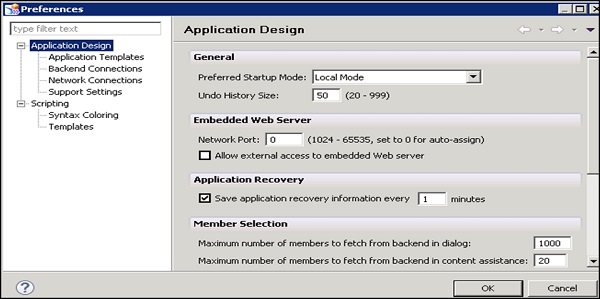
Storage of Applications and Images
Application files and images are stored in a folder on the BI platform. It is also possible to use images and logos in the analysis application from the internet.
Analysis Applications History − The analysis applications history in the Application menu is persisted in your cache file <home directory>\.sap\com.sap.ip.bi\cache.
Data Source History − The data source history in the Add Data Source dialog box is persisted in <home directory>\.sap\com.sap.ip.bi\cache.
SAP Design Studio - Create an Application
You can create new analysis applications in SAP Design Studio. SAP provides a list of predefined templates that are suitable to open in web browsers or mobile platform. You can select from a list of predefined templates and the system creates a copy of this template.
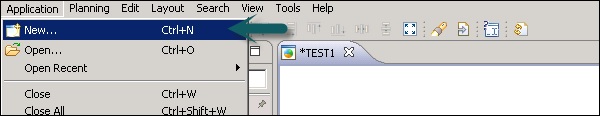
How to Create a New Analysis Application?
To create a new analysis application, navigate to Application → New.
A new application dialog box opens, you can then enter the following fields −
- Name of the Application
- Description
Template Category
It is used to define the target device. When you want to create an analysis application for a desktop browser or a mobile device. When you can also change the type of your application by going to the Application properties view.
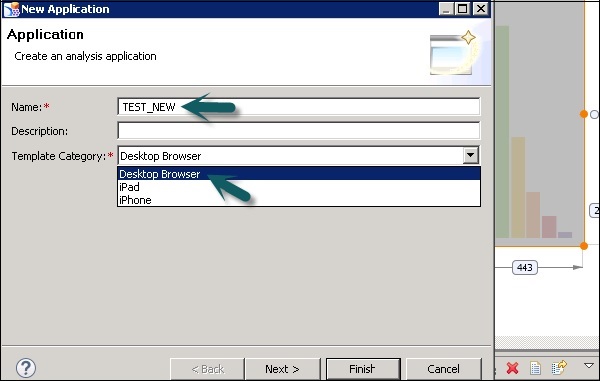
Click the Next button. Select the template for a new application as per the template category. You can also select a blank template to create an empty application.
You can also see a brief description of each template just below the template name as shown in the following screenshot.
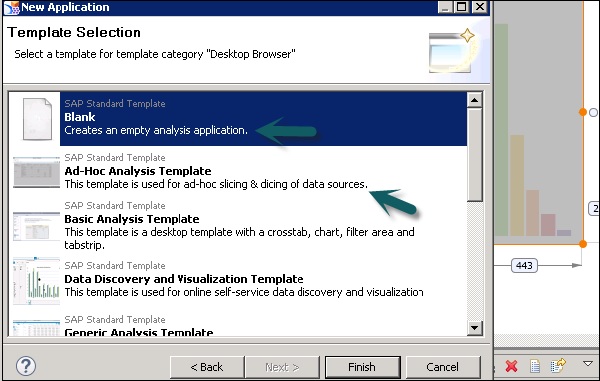
Click the Finish button. You can add components from the component view to the editor area.
In the Components view, click on a component → Drag and drop the component of your choice into the editor area.
Drag and drop the component of your choice into the Layout folder of the Outline view.
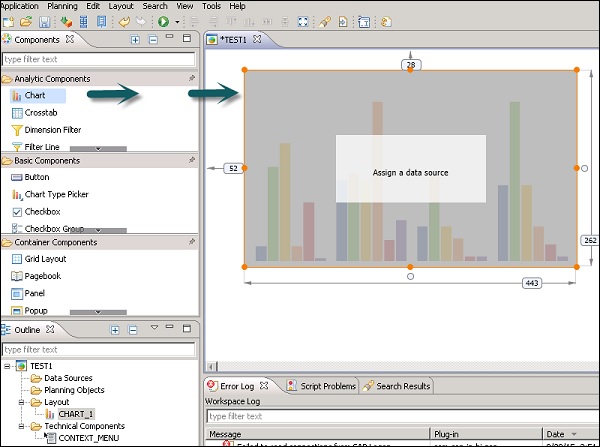
Enter a text in the filter text box at the top of the Components view, if you want to filter for a certain component.

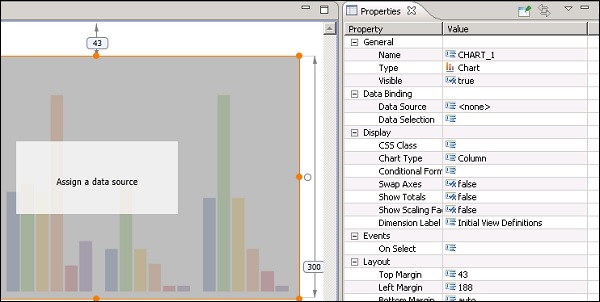
The next step is to specify and change the properties of the components you have added to the application.
Click on a component in the editor area. Then you can click on a component in the Layout folder of the Outline view.
The properties of this component are available for editing under the Properties view. In the Properties view, click on the property you want to change. A field can have different values as per type −
- Numeric − Like for layout properties
- String − Like for caption, etc.
- Boolean − Like True/ false from drop down like for Style, etc. and
- Dialog Box
For a few special property types, you can open a dialog box by clicking on the value tab.
How to Set a Layout for a Component?
While setting layout for a component, you can adhere to the following points −
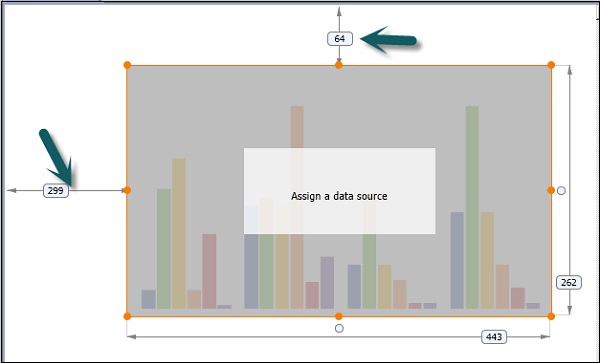
There are three properties that specify the position and size of a component in an application −
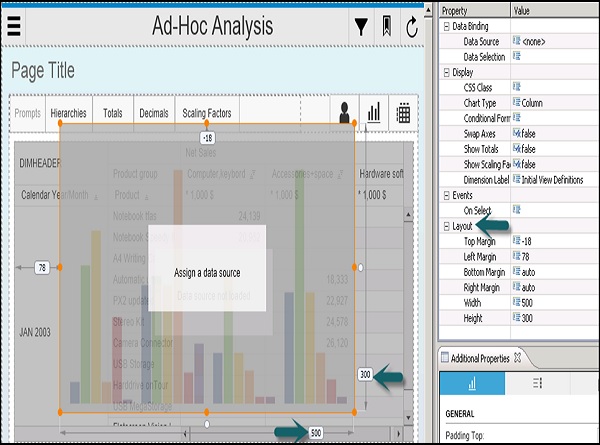
Margin (Top, bottom, left, right)
Width − This tells the distance to the left margin and distance to the right margin along the horizontal axis.
Height − This tells the distance to the top margin and the distance to the bottom margin along the vertical axis.
To allow relative resizing of the components as per the web browser, you need to set any of these three properties to automatic.
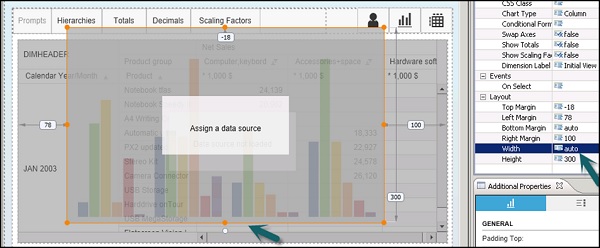
Please note that you cannot set all the three properties to automatic mode.
SAP Design Studio - Add Data Source
In this chapter, we will discuss on how to add a data source in the design studio.
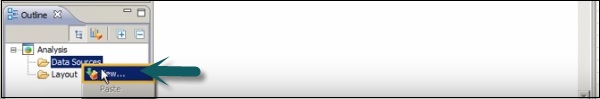
To add a data source, go to the Outline View → Data Sources folder.
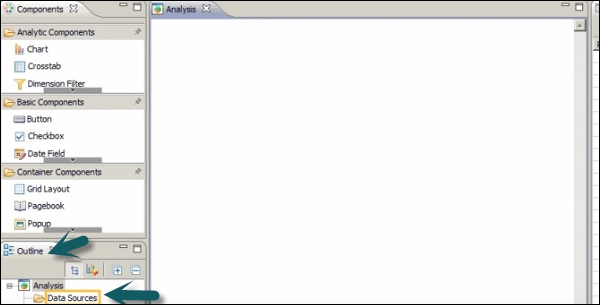
Right-click on the folder → New
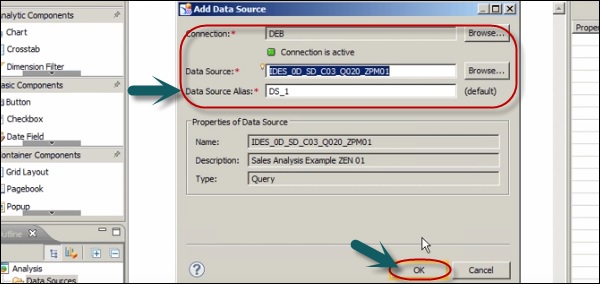
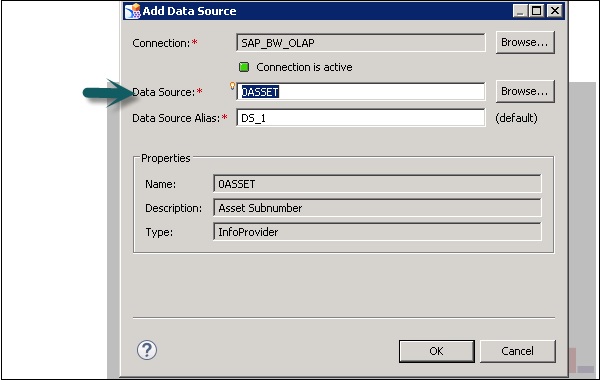
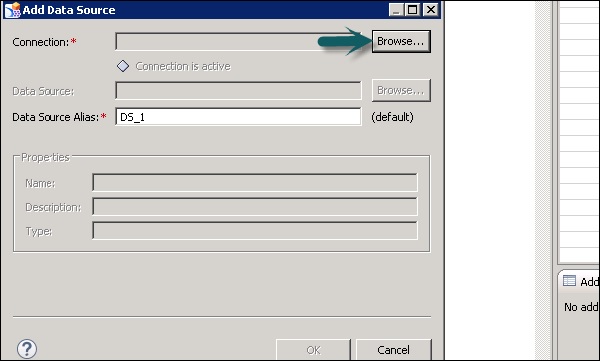
It will open the add data source wizard. To add a connection, click on the Browse tab and select the connection.
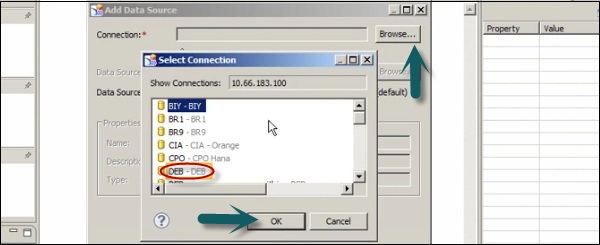
Once you select the connection, data source option will be enabled. Go to Browse → Search tab and enter the data source name.
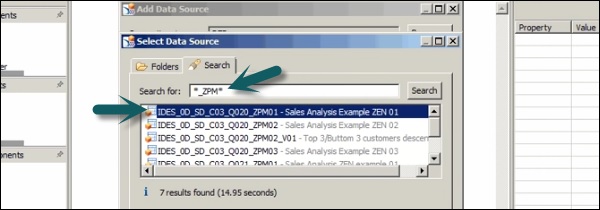
The data source alias is automatically assigned. Click on the OK button. Then the data source is added to the outline pane.
SAP Design Studio - HANA Connectivity
To allow SAP HANA connectivity, you can use the existing backend connections to Design Studio. Go to Tool → Preferences.
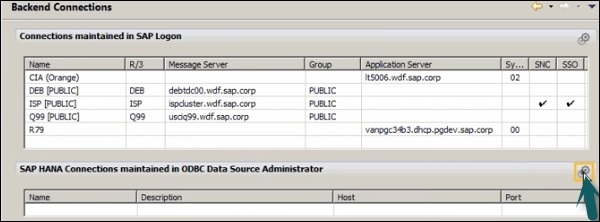
In next window, Application Design → Backend connections
How to Create a New Connection?
To create a new connection to SAP HANA using HDB ODBC drivers, click on the icon to add a connection.
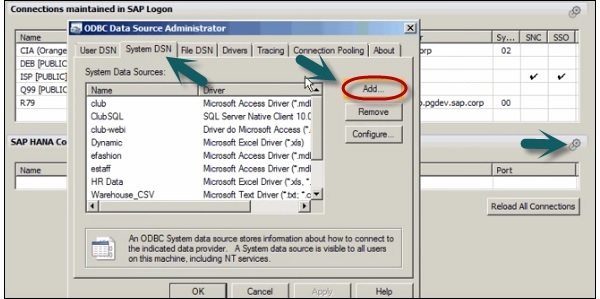
In the ODBC Data Source Administrator, go to System DSN → click on Add.
In a new window, you have to search for the HDB ODBC database drivers. These drivers get installed when you install SAP HANA client.
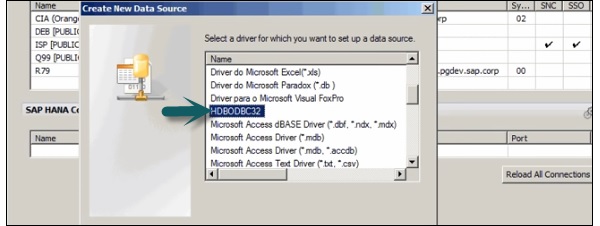
Click the Finish button.
In a new window, you need to enter the following details of the HANA system.
- Enter the Host name
- Port Number (3xx15, xx-instance number)
- User name and Password and click OK.
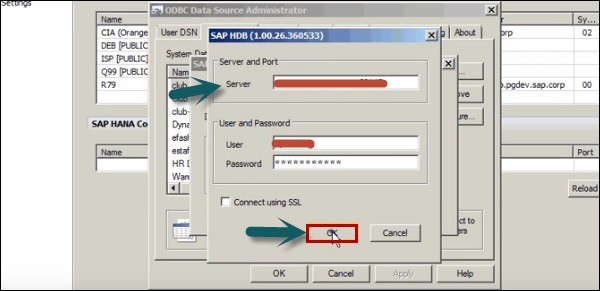
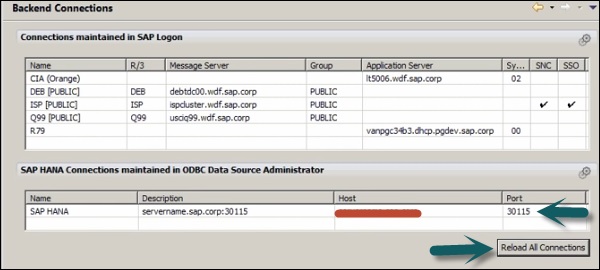
You can check the connectivity by clicking on the Connect button → Connection Successful. To see the new connection, click on Reload connection. To use the connection, you may need to reopen the Design Studio.
SAP Design Studio - Setting Up Bookmarks
When you create an analysis application in the Design Studio, you can create bookmarks for reusability and flexibility. Bookmarks can be created for the snapshot of the full application or a part of it. There are three types of bookmarks that can be used in Design Studio −
- Standard
- Fragment
- Portable fragment
When an application developer wants to serialize the state of entire application, standard bookmark can be used. To use a selected part of an application, a fragment or portable fragment bookmark is used.
Loading Bookmarks Using Scripting
To load a bookmark in running analysis application, you can use scripting method.
To load a standard bookmark, you can use the following format −
Bookmark.loadBookmark(id);.
Now to select a bookmark id, you can select from the drop down list.
var id = DROPDOWN_1.getSelectedValue();
Bookmark.loadBookmark(id);
To load a fragment bookmark, you can use the following scripting method.
Bookmark.FragmentBookmark.loadBookmark(id)
To load a portable fragment bookmark, you can use the following scripting method.
Bookmark.PortableFragmentBookmark.loadBookmark(id)
Loading Bookmarks Using URL
You can also load bookmarks shared by other application user via a URL in the browser bar. All the bookmarks that are shared via a URL cant be directly added to the user lists of that bookmark.
You can bookmark the shared analysis application and that bookmark is then listed when calling the script method.
Bookmark.getAllBookmarks()
Bookmark.FragmentBookmark.getAllBookmarkInfos()
Bookmark.PortableFragmentBookmark.getAllBookmarkInfos(groupIdentifier)
You can also save the URL to browser favorites.
Listing Bookmarks
You can use the scripting API to allow application users to retrieve a list of their own bookmarks at runtime. The following script methods are used, depending on the type of bookmark involved.
How to List Standard Bookmarks?
The returned array contains a list of BookmarkInfo object types. A BookmarkInfo object contains BookmarkId id, String name and String text. Both the String name and BookmarkId id refers to the bookmark id. The string text refers to the bookmark title. Any selection component like a Dropdown box or a List box can be populated with the array returned from the Bookmark.getAllBookmarks(); method.
var array = Bookmark.getAllBookmarks();
array.forEach(function(element, index)
{ DROPDOWN_1.addItem(element.name, element.text);
});
How to List Fragment Bookmarks?
You can list the fragment bookmarks to return the list of all fragment bookmarks for an analysis application −
var array = Bookmark.FragmentBookmark.getAllBookmarkInfos();
array.forEach(function(element, index)
{ DROPDOWN_1.addItem(element.id, element.title);
});
How to List Portable Fragment Bookmarks for all the Applications?
You can use the following scripting method.
Bookmark.PortableFragmentBookmark.getAllBookmarkInfos();
This returns a list of all portable fragment bookmarks specified by the Group Identifier parameter. You can populate the Fragment Gallery with all portable fragment bookmarks created by the user using the FragmentGallery_1. addItems(); scripting method.
var array =
Bookmark.PortableFragmentBookmark.getAllBookmarkInfos(groupIdentifier);
FRAGMENTGALLERY_1.addItems(array);
Saving and Sharing Bookmarks
In SAP Design Studio, an application user can save their bookmarks using the API scripting. You can save standard bookmarks with a unique title mentioned by the users.
You can use the following script to save a standard bookmark.
var id = Bookmark.saveBookmark();
var id = Bookmark.saveBookmark("title")
You can also save a fragment bookmark using the following method.
var fragInfo = Bookmark.FragmentBookmark.saveBookmark(ContainerComponent);
You can use method an Optional BookmarkInfo toOverWrite to overwrite an existing fragment bookmark.
Sharing a Bookmark
Application designers can also share their bookmarks using a scripting method. You can run the following scripting method as per the type of the bookmark.
To share a standard bookmark, you can apply − Bookmark.shareBookmark(String URL) scripting method.
To share a fragment bookmark, you can apply −
Bookmark.FragmentBookmark.shareBookmark(String URL) scripting method.
To share a portable fragment bookmark, you can apply −
Bookmark.PortableFragmentBookmark.shareBookmark(String URL) scripting method.
Deleting Bookmarks
In SAP Design Studio, each bookmark owns a parent application. When you delete a parent application, its child bookmarks are deleted. To delete these bookmarks, you can use scripting API methods.
The following scripts can be used as per the bookmark type.
How to Delete Standard Bookmarks?
You can use the following script to allow the application user to delete their own standard bookmarks.
Bookmark.deleteBookmark(id);
Bookmark.deleteAllBookmarks();
How to delete Fragment Bookmarks?
You can use the following script to allow the application user to delete their own fragment bookmarks.
Bookmark.FragmentBookmark.deleteBookmark(id);
Bookmark.FragmentBookmark.deleteAllBookmarks();
How to delete Portable Fragment Bookmarks?
The following scripting method is used to allow the application user to delete their own portable fragment bookmarks.
Bookmark.PortableFragmentBookmark.deleteBookmark(id)
Bookmark.PortableFragmentBookmark.deleteAllBookmarks(groupIdentifier)
Design Studio - Working with Data Sources
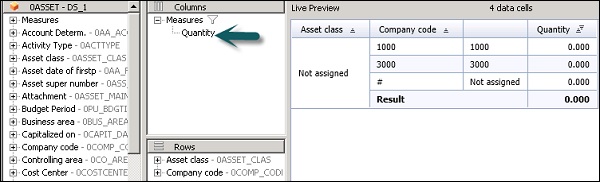
In SAP Design studio, you can work with data sources, edit the initial view of data source, add dimensions and measures to crosstabs and charts, etc.
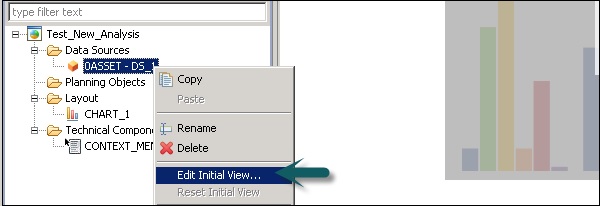
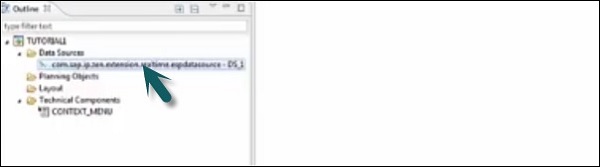
We have added the following data source under the Outline view of the Design Studio.
To edit an initial view of the data source, right click on the Data Source Name → Edit Initial View.
In the next window, you can see a list of all the dimensions and measures in the data source.
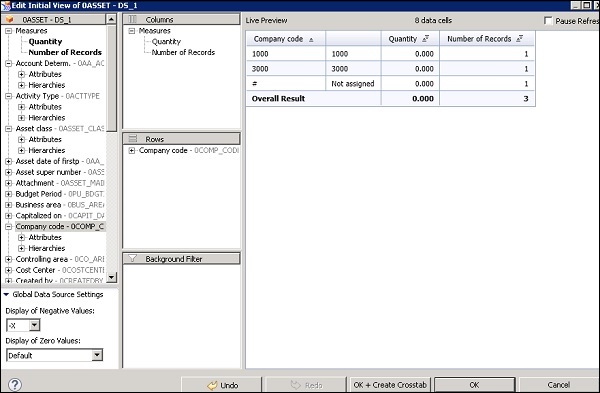
How to Add More Dimensions in the Data Source?
You can also add more dimensions and measures by dragging objects from the left pane to the Rows and columns box.
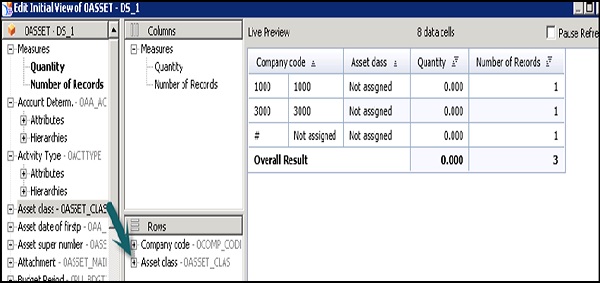
You can also change the order of dimensions and measures. You can select the dimension and drag it up or down as per the requirement. Data in the crosstab also changes as per the selection.
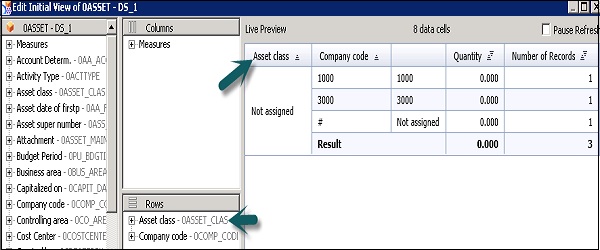
You can also remove the extra columns from the crosstab. Select the column from the dimension/measures and move it to the left pane.
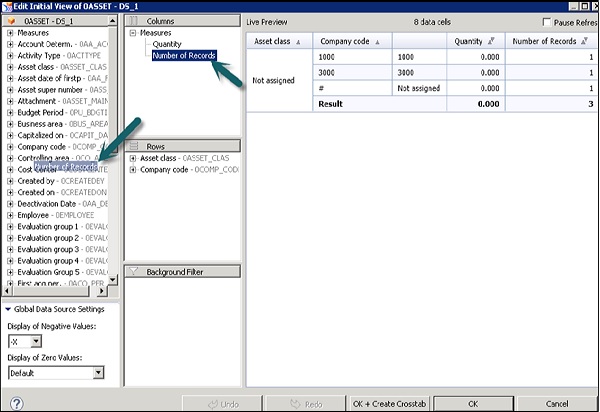
Once you remove the extra column, data in the crosstab will also change accordingly.
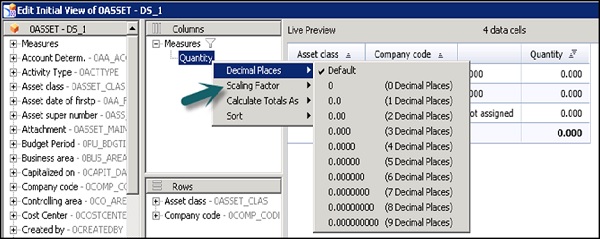
You can also perform various other functions on the selected values, some of which are −
- Decimal places
- Scaling
- Calculate Total As
- Sort
SAP Design Studio - Connect to a UDS
You should connect to BI platform to add data source to a new analysis application in Design Studio. You have to connect to BI platform at the time of login.
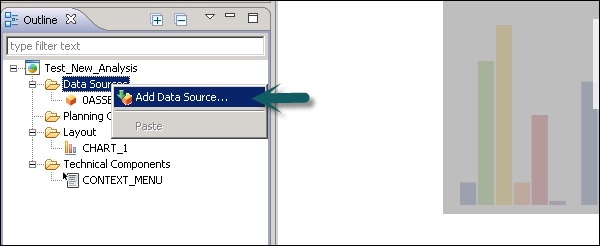
To connect to a Universe Data Source (UDS), go to the Data Source folder under Outline in a new analysis application Right click → Add Data Source.
How to Add Universe as a Data Source?
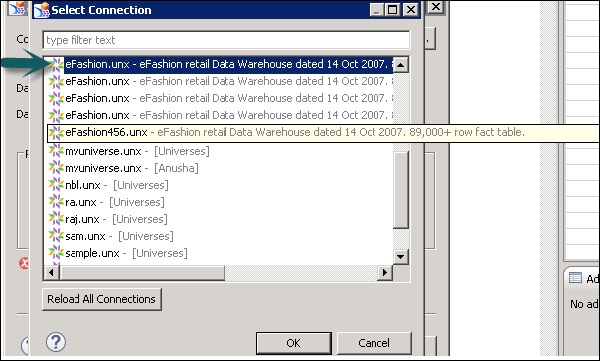
Let us see how to add Universe as a data source. Click on Browse tab against Connection in the Add Data Source window.
Select eFashion.unx file to add a connection. You can also filter the connection from the available list.
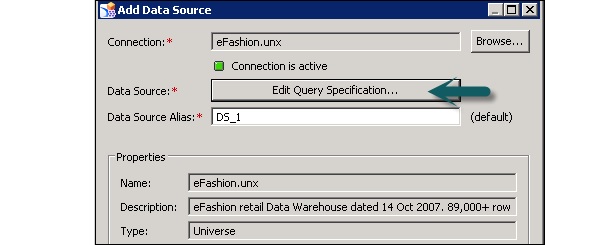
The next step is to edit the query panel. For this, you have to click on the Edit query specification.
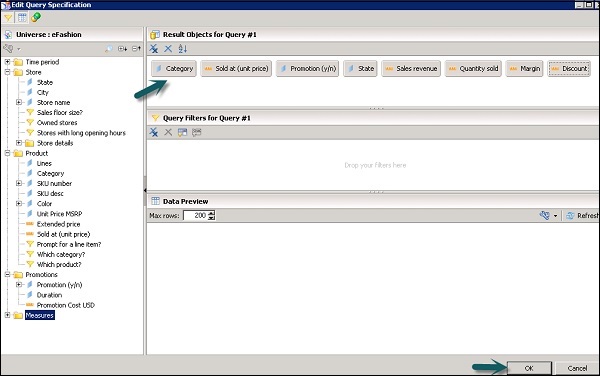
Add the dimensions and measures to result objects. You can expand each of these folders in the left pane and add objects to dimensions and measures.
Once you select all the objects, click on the OK button of the query panel. This query will be added to the add data source window. Click on OK to add this to the Data source folder under the Outline view.
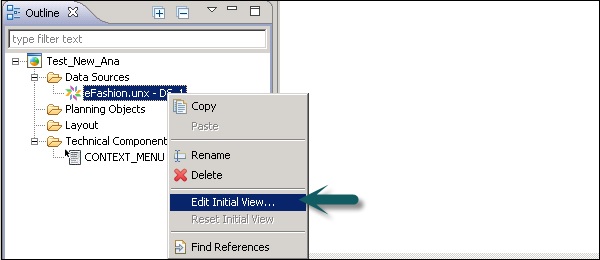
To edit the initial view, right click on the Data Source → Edit Initial View. The measures will be added to the preview tab directly.
Add the dimensions selected in the query to Row tab.
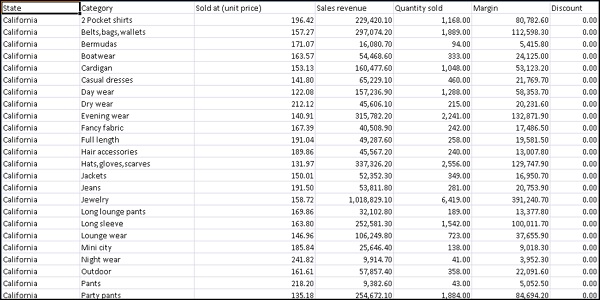
In the following screenshot, we have added State and Category to come with measure values. You can apply formatting to measure values.
Click OK and then click on Create Cross tab.
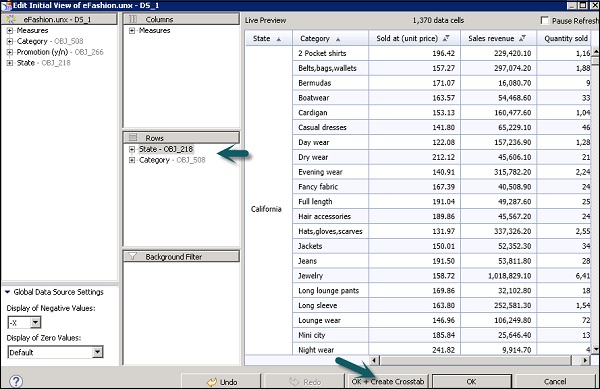
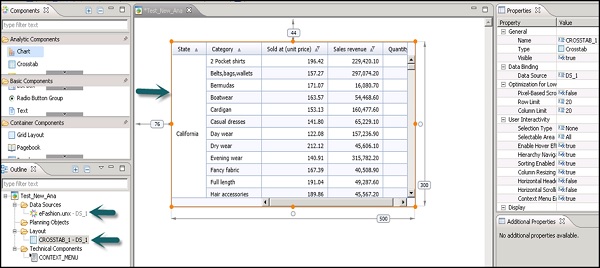
A Cross tab has been added to the editor area and this is how you can connect to the Universe Data Source.
SAP Design Studio - Exporting Data
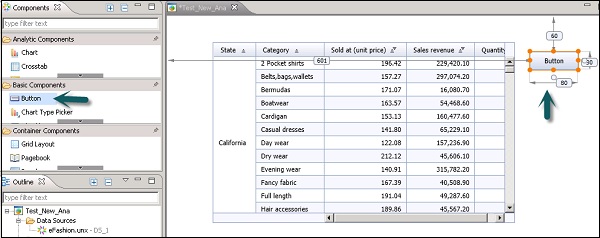
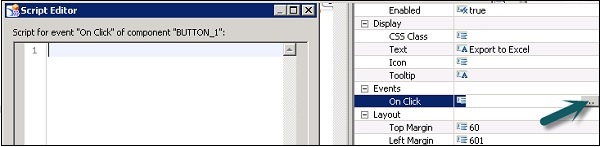
We have a crosstab in SAP Design Studio Editor and we want to export the data from a Crosstab to Microsoft Excel. Add a button from the basic components to the Editor as shown in the following screenshot.
Under Display, add Text Export to Excel.
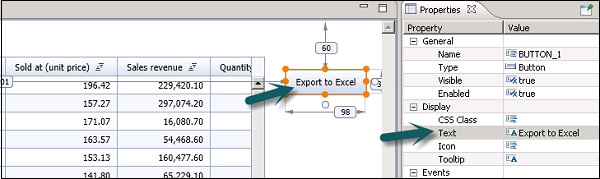
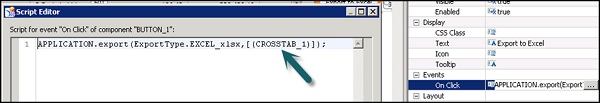
Go to Event and add a script as shown in the following screenshot.
Script to export to Excel
APPLICATION.export(ExportType.EXCEL_xlsx,[(CROSSTAB_1)]);
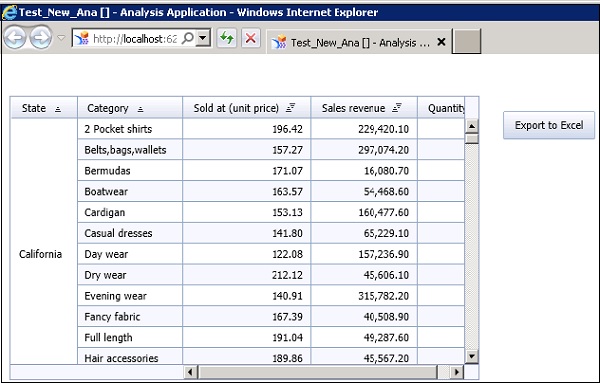
Now execute the application using the arrow mark at the top. Once it is run, click on Export to Excel.

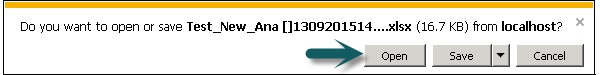
Click on Open or Save to open the excel sheet or to save the sheet to your system.
SAP Design Studio - HANA Mode Interactive
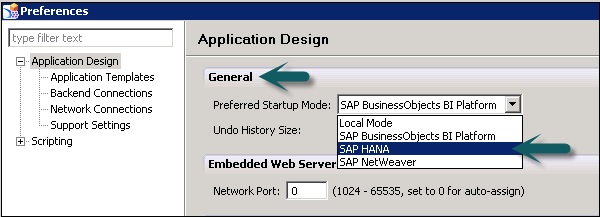
The SAP Design Studio starts locally and it is possible to change the setting to SAP HANA mode by going to Tools → Preferences.
In Application Design, you need to select SAP HANA as the design mode instead of local and you can use SAP HANA as the data source to design applications.
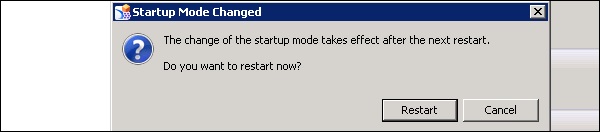
You need to restart and when in the start-up mode change it to Design Studio. Once you click on OK, it will ask you to restart the Design Studio.
You can add a data source using SAP HANA connection now.
Connect to a Streaming Data Source
Streaming data sources in SAP allows you to create visualization on real time data in the Design Studio. To connect to a streaming data source, you should have real time package installed and Design Studio 1.4.
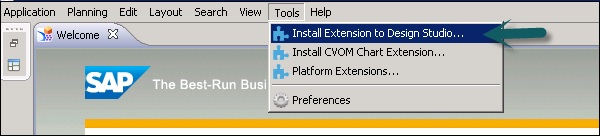
You can download these from SAP Marketplace. To install Real time package, go to Tools → Install Extension to Design Studio.
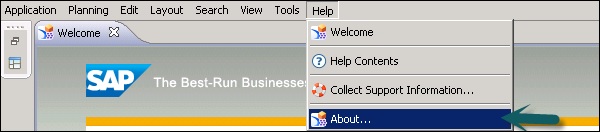
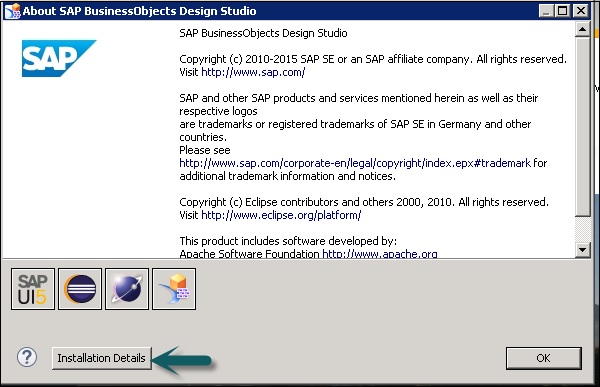
You can check real time functionality by going to the Help tab.
Along with the real time package, you need SAP Enterprise streaming package ESP SP9.
Create a Time-Based Line on Real Time Streaming
Time based line charts can handle null values if there is break in data as compared to the standard line charts.
Your streaming data source is also configured and connected to ESP.
Add your chart component to the editor area in the Design Studio.
Drag the data source to the chart as shown in the following screenshot.
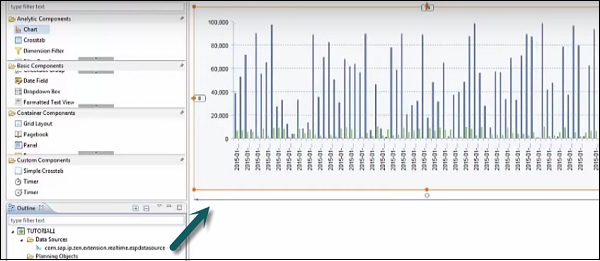
You can go to the chart type to select Additional charts from the drop down list.

Design Studio - Working with Info Charts
Info charts can be found in SAP Design Studio under the Analytic components. This is a new feature available in the Design Studio 1.6. You can configure info charts independently of the initial view. When you configure info charts, dimensions from the data sources is bound to specific chart areas.
You can have two dimensions in a row in the Info chart which was not possible in normal charts in the Design Studio.
Info charts can be considered as the main component for creating new Dashboards in the Design Studio 1.6 however other chart types are also available.
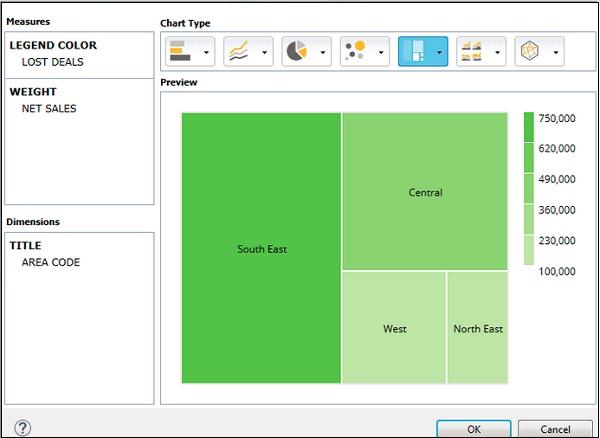
Info Chart Feeding Panel
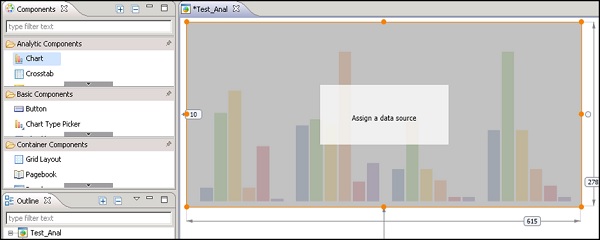
You can configure Info charts like other charts in the Chart editor. You have to drag the chart component to the canvas and add a data source from the outline view. When you assign a data source, a chart is created as per the values.
To configure an info chart, you have to go to the chart configuration properties. You can perform the following functions in the properties tab.
Change the dimension by dragging to each group. The available group depends on the chart type selected for the Info chart.
You can also change measure the assignment in the chart type.
You can also change the chart type.
Features
Chart type picker and chart feeding panels are two features that you can use with Info Chart. The feeding panel is a component that allows you to bind dimensions and measures with chart area.
You can configure the chart at run time and dimensions and measure changes as per binding.
Chart type picker allows you to select the chart type which is suitable. Chart type picker works with both charts and info charts.
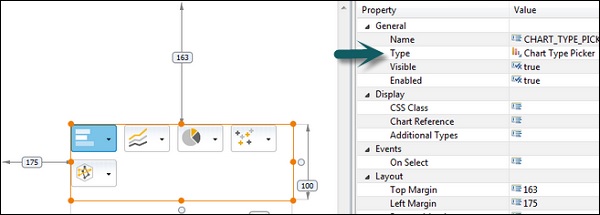
To add chart type picker, it is available under the list of basic components.
Note − Info Charts also support the scripting method that are used in the Chart component regarding selection and behavior.
Changing the Visualization Type
To analyze the data in different ways, you can select different visualizations. Select a different visualization type from the dropdown arrow to the right of a group within the Chart Type Picker palette.
Your visualization type changes accordingly to render your data in a different way.
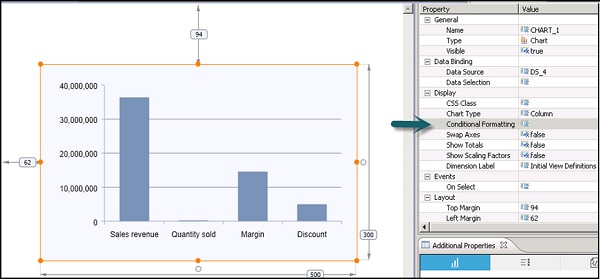
Conditional Formatting
You can use Conditional formatting to change the chart appearance when a specified condition is met. This feature allows you to add conditional formatting rules to measures or dimensions in chart components. These rules change the chart appearance when a specific condition is met.
To apply conditional formatting to a chart, select the chart component and go to the Properties tab.
Click on the browse button, a new window will open. Select New rule to add a new rule for conditional formatting.
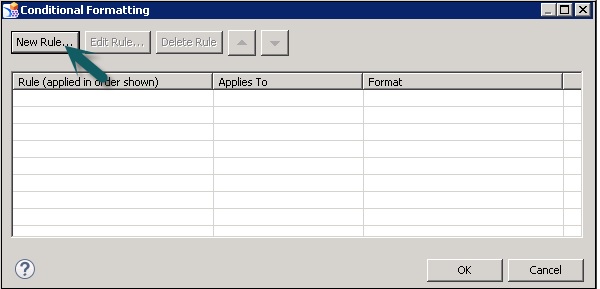
Choose New Rule → A New Rule dialog box opens.
In the Name textbox, enter a title to identify your new conditional formatting rule.
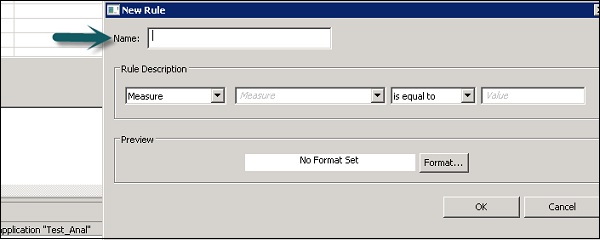
Within the Rule Description area of the Conditional Formatting dialog box, select either Measure or Dimension Member from the dropdown list. The dropdown list is populated from the data set you have applied to your chart.
You can apply to the following data set to your chart.
Select one of the following −
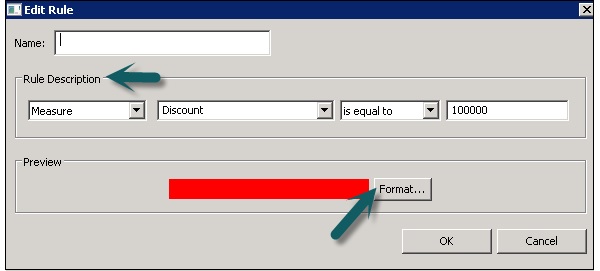
- is equal to
- is greater than
- is less than
Enter the value to be assigned to the new rule.
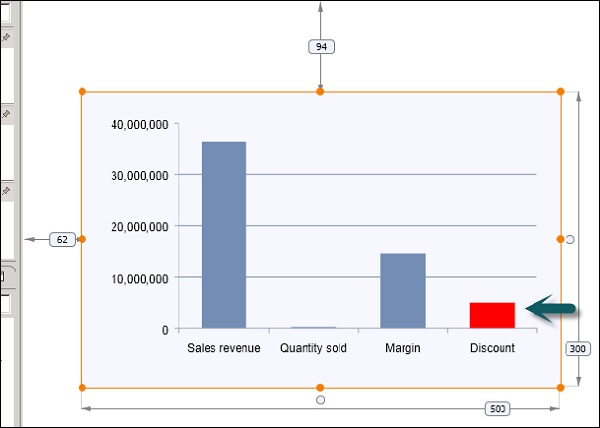
Within the Preview area of the dialog box, choose the Format button to assign a color to your rule. Choose a color from the pre-defined color picker or define a custom color by choosing the Define Custom Colors button.
Click OK.
SAP Design Studio - Working with Filters
Filters are used to limit the data in visualization in SAP Design Studio. You can create different types of filters and use analytic components and basic components to set up filters.
Setting up an Analytic Component as a Filter
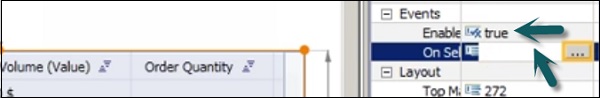
To set an analytic component as a filter, you need to enable the selection that allows the user to select the individual component.
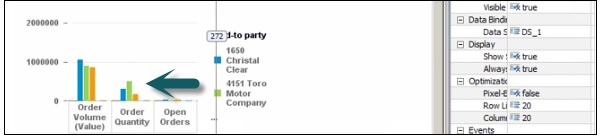
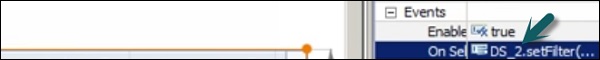
Select Analytic component → Properties Pane, under Events Enable → True. Go to Onset to add a script to this event. You can use the setFilter script method to set the filter.
In the script, you need to select the Data source, scripting method, dimension and value.
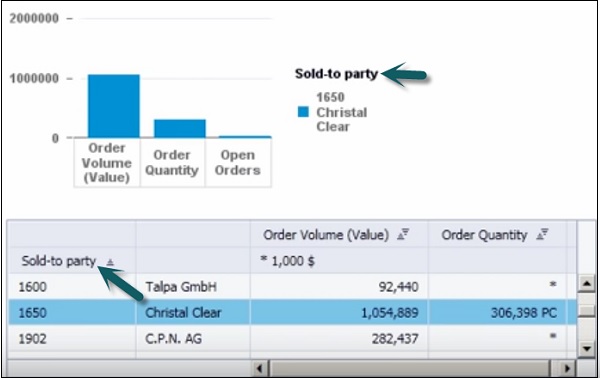
DS.setFilter(00_Sold_To, CROSSTAB.getSelectedMember(00_Sold_To).internalkey);
Save the application and run it locally. Select the Sold to Party component.
You can also set up a basic component as filter in the similar manner.
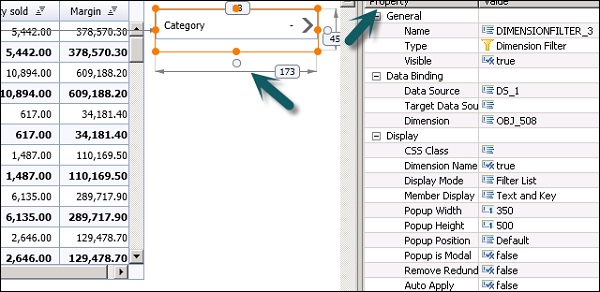
Adding a Dimension Filter
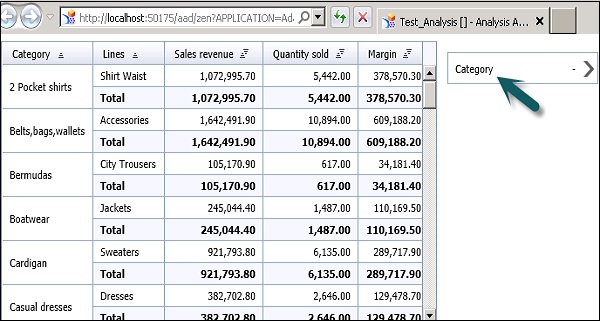
To add a dimension filter, select a filter from the analytic components and drag it to the canvas area.
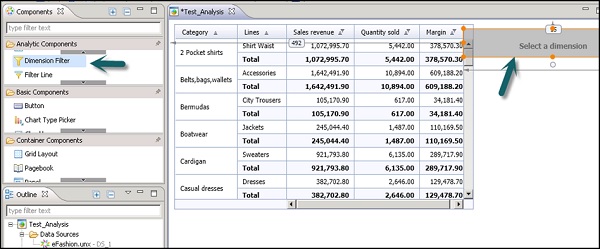
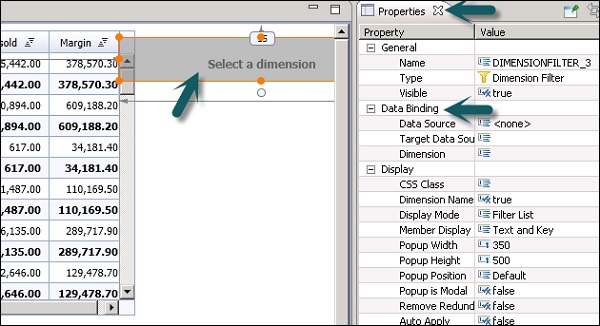
Go to the Properties tab of the Dimension filter → Data Binding. Then Under Data Binding, select a data source.
Go to dimension, and select the dimension on which you want to apply the filter.
Select the Data source and dimension as shown in the following screenshot and then save the application.
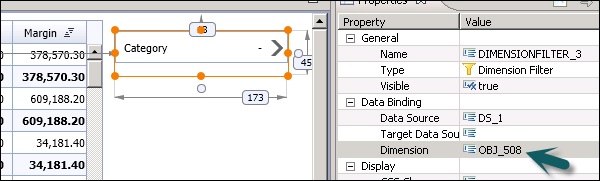
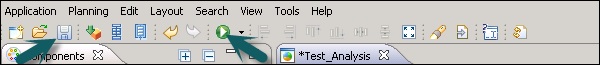
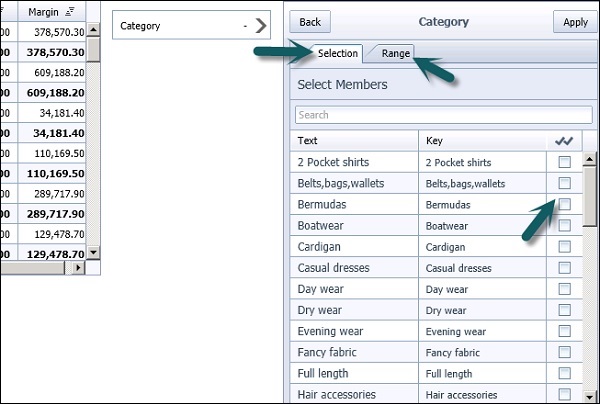
Once the application is saved, then you can run the application locally.
Click on the dimension Filter and you will be prompted to select a dimension value from the available list. You can also go to the range tab to put a start and end value.
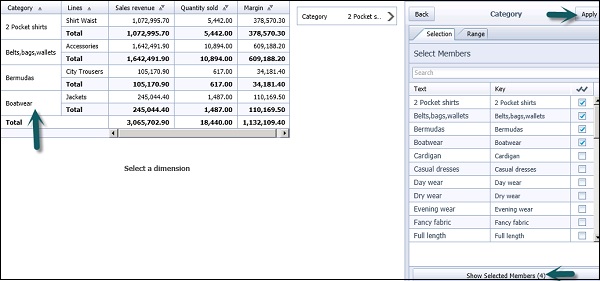
Once you select the dimension, data in component is filter accordingly. To apply the filter settings, click on the Apply button.
Editing a Filter
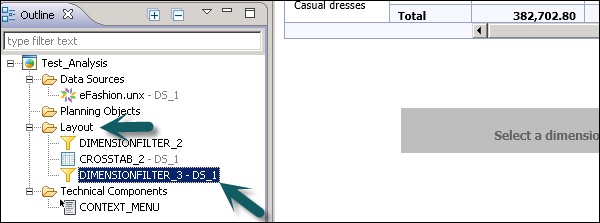
To edit a filter in SAP Design Studio, go to the Outline tab and under the Layout folder. There you can see a list of all the filters that are applied in an application. To edit an application, select the filter you want to edit.
Go to the Properties tab of the selected filter and make changes as required. Save the changes that you have made and run the application to reflect the changes.
Removing filter
To remove a filter in an analysis application, go to Outline View → Layout. Select the filter you want to remove. Right click and you will get all the following options.
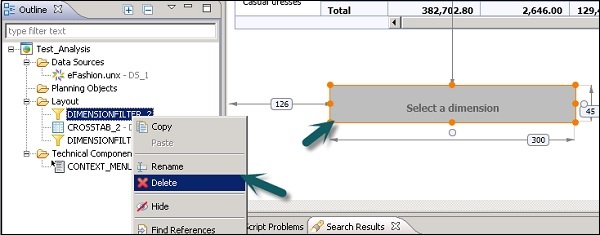
Click on Delete to delete the selected filter as shown in the above screenshot.
You can also Copy, rename or check reference of each filter in an analysis application from here.
SAP Design Studio - Geomap
In SAP Design Studio, you can use a Geomap to display different layers of geographical information. These Geomaps are available under the Analytic components and can be added by simply dragging them to the canvas.
As per the Geomap properties and scripting defined in the Geomap component, each layer shows different data as per the user interaction. To use Geomaps, the data source should contain countries, regions, longitudes, etc.
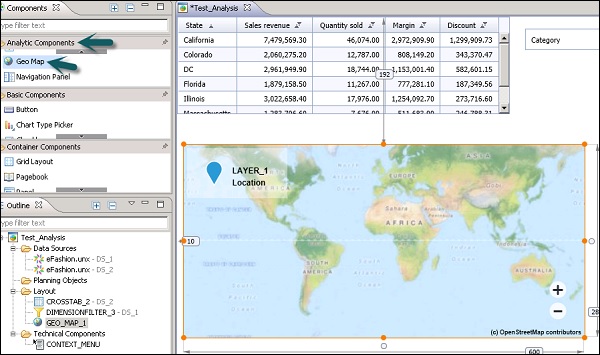
To start with Geomaps, drag the Geomap from analytic components to the Canvas area and add the data source to the Outline view. The data source added will also reflect under Additional Properties → Data Source.
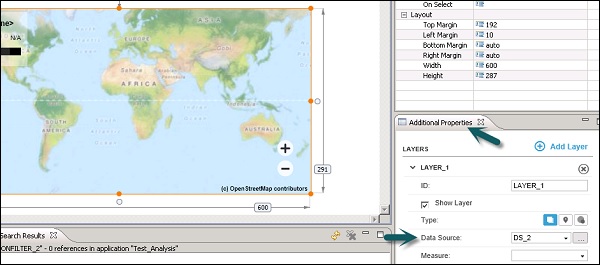
Go to Edit Initial view of the data source, you need to select only one Geo dimension under Rows and measures under column tab.
You can select the Geo Map in the layout pane. In the Properties tab, enter the URL for your selected basemap in the Basemap URL property. It is also an option to leave this blank, if no basemap is required.
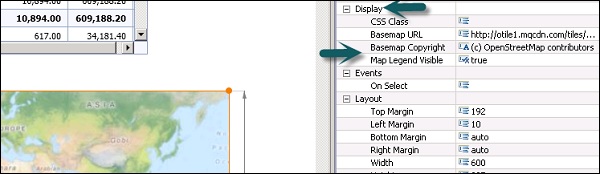
The Map Legend Visible property is set to true by default. If you wish to hide the legend on all your Geo Map layers, you can set this property value to false.
You can also add or remove layers to a Geomap. This can be done by using Add layer button in the Geomap.
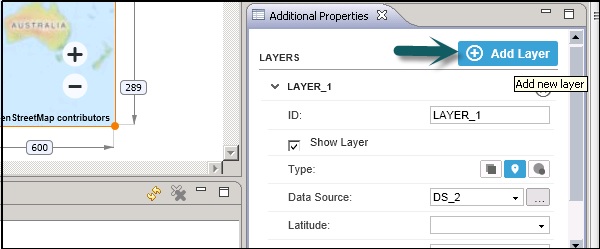
A new layer Id is added for each layer, you can select the Data source and measure values.
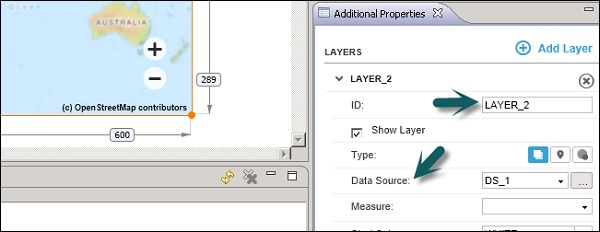
To remove a layer, you need to click on the cross button at the top right corner under Additional Properties.
Design Studio - Exporting an Application
In SAP Design Studio, you can also export your analysis applications to the local machine or to a network shared drive. This allows you to export the source code to send to SAP for resolving errors or to use on a different BI platform. You can also perform regular backup of your analysis application using export options.
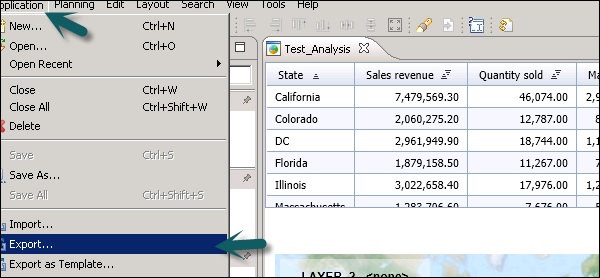
To export an application, select the application and then click on Export under Application tab at the top. If your application is not saved, you will be prompted to save the application.
You can select any other application by clicking on the Browse button. By default, it shows the open analysis application.
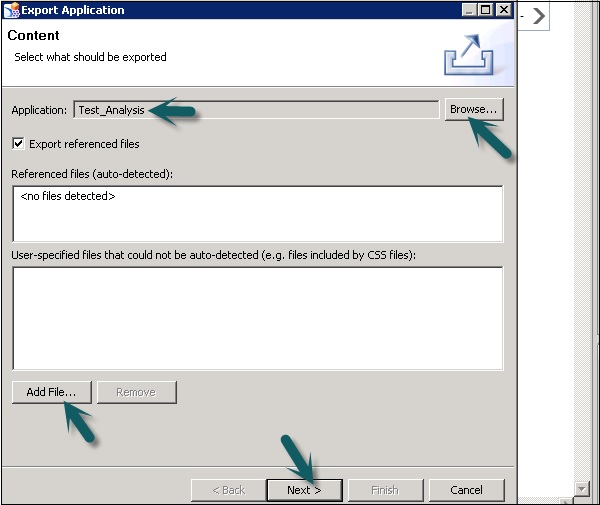
To have the MIME objects example images or CSS files which are referenced in the application or exported, you should keep the Export referenced files checkbox activated.
The system analyzes the selected application and auto-detects all MIME objects referenced by the application. If you have MIME files that the system cannot auto-detect, choose Add File... and then select the required files.
Click on Next.
To select the target folder on your local PC or on a network share, click on Browse.
You can change the default name of the ZIP file, enter the required name under the ZIP File Name.
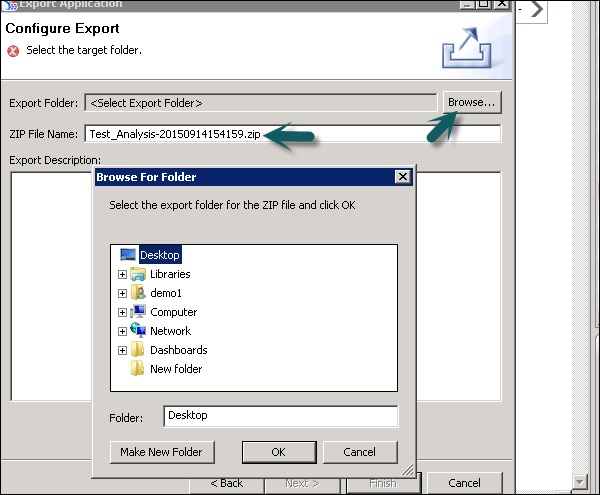
The default name of the ZIP file is the name of the application suffixed with a timestamp as shown in above screenshot.
SAP Design Studio - Exporting an Templates
In SAP Design Studio, you can use your analytic application to be used as the template for other application designers.
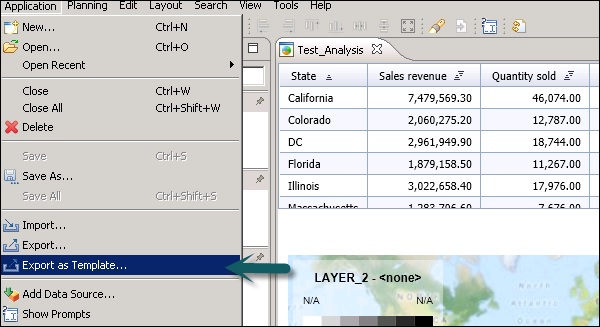
To export an application as a template, Select Application → Application Tab → Export as Template.
You can select any other application by clicking on the browse button. By default, it shows the open analysis application.
To have the MIME objects example images or CSS files which are referenced in the application, exported, keep the Export referenced files checkbox activated.
The system analyzes the selected application and auto-detects all MIME objects referenced by the application. If you have MIME files that the system cannot auto-detect, choose Add File... and select the required files.
Click the Next button.
Select the template folder or network drive. Enter the Template Name → Select the Template Category from Desktop, iPad, iPhone as shown in the following screenshot.
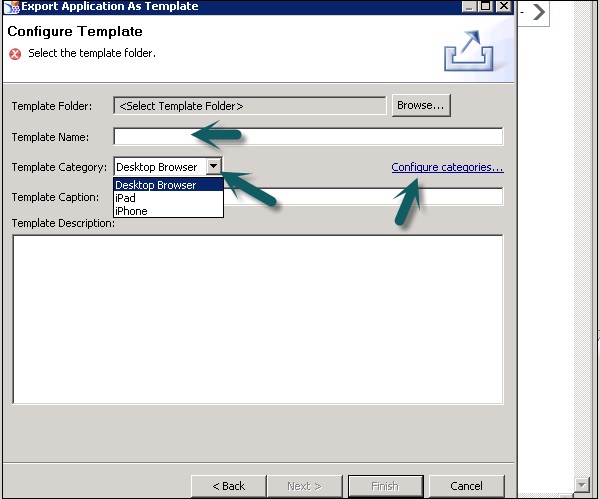
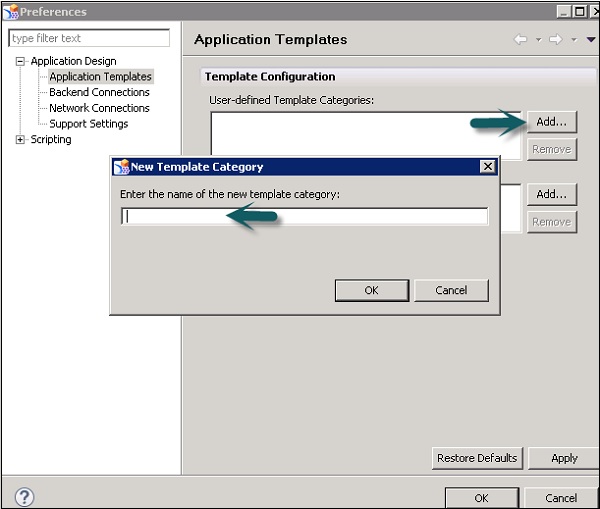
You can also add your own categories by going to Configure Categories → Preferences. To add a new template category, click on the Add button and then you can Enter the new category name.
Template Caption is used to enter the name of the template to be displayed in the New Application dialog box.
Note − This name is case-sensitive.
Under Template Description, you can describe the content and purpose of your template.
This description is displayed in the New Application dialog box and can help other application designers identify which template to select.
Click Finish.
You can find the new template in the selected folder with the content.biapp file and an .info file with the template description.
Printing an Application to a browser
You can also print your analysis application to a web browser in the SAP Design Studio. This feature is not supported when you use SAP Design Studio mobile solution.
To print an analysis application to browser, select the component to call Print function. This will print your analysis application to your web browser.
SAP Design Studio - Visualization Templates
In SAP Design Studio, you can create custom dashboards using visualization templates representing data from different data sources. You can use SAP BW or SAP HANA as the data source.
Open the online self-service data discovery and visualization application. In next window you will be prompted to connect to a recently used query or a data source.
You can select from the following two options −
You can select recently used queries to select a query from a list of all the queries you have already used till date.
You can also select a system to selects the data source and the query you want to assign to your dashboard, if there are no recently used queries listed.
Select Next and OK.
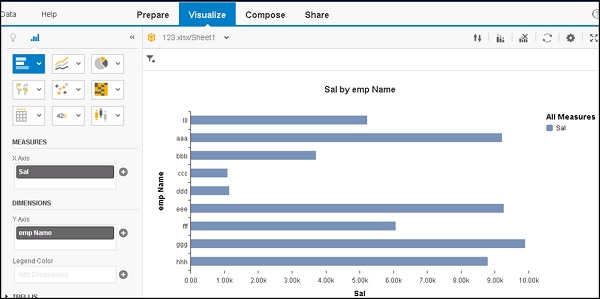
The default Visualize page opens, displaying the measure and dimensions from your selected data source.
Creating Visualizations
Go to Visualize page, drag and drop dimensions to the rows or columns area.
The default visualization in the layout area changes automatically to reflect your dimension selection and the created visualization is automatically saved to the gallery.
Select the member you want to display to the X-axis and the Y-axis.
Renaming a Visualization
You can rename the visualizations according to the queries that are used to create them. To rename a visualization select the cogwheel at the top under the Visualize tab as shown in the following screenshot.
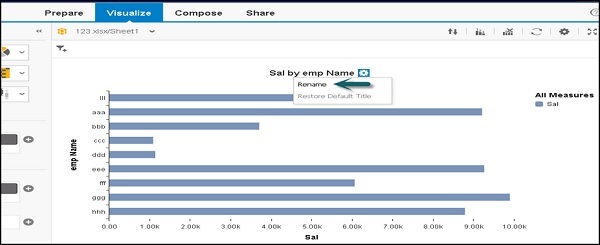
You can select Rename to change the name of the title.
Restore Default Title − This can be used to restore the title to default as per the query.
SAP Design Studio - Custom Dashboards
You can create number of visualizations and add them to the gallery and they can be used to create dashboards by arranging them in a story under the Compose tab.
This allows you to create a custom dashboard, you can change the data sources and visualization also gets changed in the Visualize tab.
Go to the Compose page at the top, the gallery shows all the current visualizations. To create custom dashboards, drag and drop the visualizations from the gallery to the layout area.
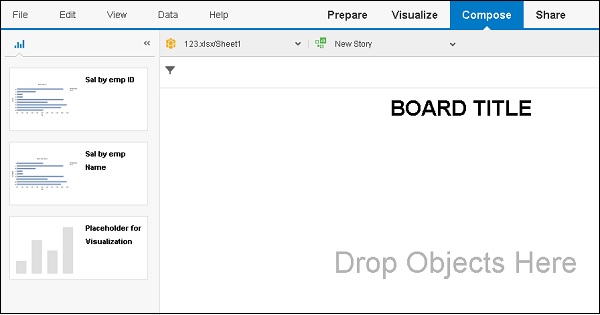
To create a new custom dashboard, select the New Story button.
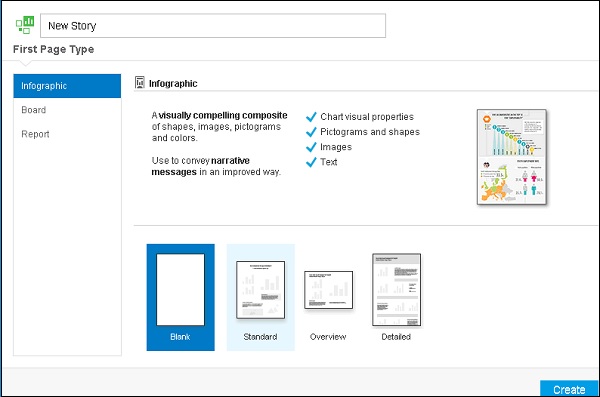
You can add title to your dashboard and then click on Create.
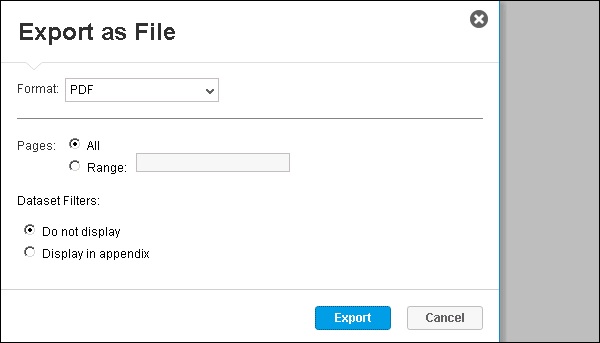
Sharing Dashboards
You can share the dashboards as bookmarks with other users. You can also export them to PDF format as shown in the following screenshot.
SAP Design Studio - Refresh a document
To refresh a document in Design Studio, a request is sent via the Web browser or a mobile client. The following are the key steps involved in data refresh −
Step 1 − To perform a refresh on Design Studio document, the user sends an HTTP request to the web browser or the mobile client to the web application server. The web application server forwards this request to the Central Management Server (CMS) to find the analysis application. The CMS server is also responsible to check if the user has access to refresh the document or not.
Step 2 − A request is sent to Analysis application server to get the current data for Design Studio document. An Analysis application service gets the current data from SAP HANA using the JDBC driver.
Step 3 − The Analysis application service creates the document with the latest data from SAP HANA and send it back to the Web Application server.
Step 4 − The last step is that Web application server converts the data to HTML format and send it to web browser or mobile client where Design document refresh data is displayed.
Refresh a Document in Web/Mobile (BW)
To refresh a Design Studio document is the same in SAP BW except that the refresh is performed using a BICS connection on a RFC call as compared to HANA using JDBC drivers.
To refresh a document in the Design Studio in web/mobile on BW, a request is sent via the Web browser or a mobile client.
The following are the key steps involved in data refresh −
Step 1 − To perform a refresh on the Design Studio document, the user sends a HTTP request to the web browser or a mobile client from the web application server. The web application server forwards this request to the Central Management Server to find the analysis application. The CMS server is also responsible to check if the user has access to refresh the document or not.
Step 2 − A request is sent to the Analysis application service hosted on the Adaptive server to get the current data for Design Studio document. An Analysis application service gets the current data from the SAP NetWeaver BW system using the Remote function to call RFC and BICS Business Intelligence Consumer Service Connectivity.
Step 3 − The Analysis application service creates the document with the latest data from SAP HANA and sends it back to the Web Application Server.
Step 4 − The last step is that Web application server converts the data to HTML format and send it to the web browser or the mobile client where the Design document refresh data is displayed.
