- SAP Design Studio - Home
- SAP Design Studio - Overview
- SAP Design Studio - Key Features
- SAP Design Studio - How To Logon
- SAP Design Studio - Navigation
- Create an Application
- Add Data Source
- HANA Connectivity
- Setting Up Bookmarks
- Working With Data Sources
- Connect to a UDS
- SAP Design Studio - Exporting Data
- HANA Mode Interactive
- Working With Info Charts
- Working With Filters
- SAP Design Studio - Geomap
- Exporting an Application
- Exporting as Templates
- Visualization Templates
- Custom Dashboards
- Refresh a Document
SAP Design Studio - HANA Mode Interactive
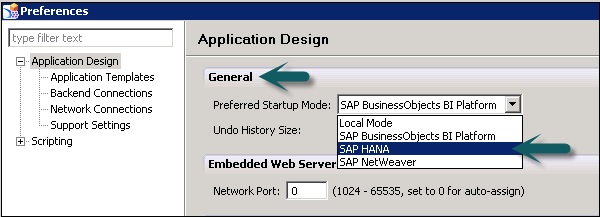
The SAP Design Studio starts locally and it is possible to change the setting to SAP HANA mode by going to Tools → Preferences.
In Application Design, you need to select SAP HANA as the design mode instead of local and you can use SAP HANA as the data source to design applications.
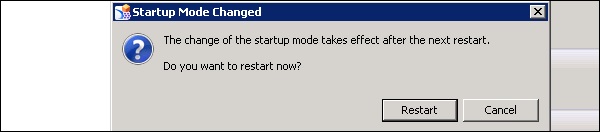
You need to restart and when in the start-up mode change it to Design Studio. Once you click on OK, it will ask you to restart the Design Studio.
You can add a data source using SAP HANA connection now.
Connect to a Streaming Data Source
Streaming data sources in SAP allows you to create visualization on real time data in the Design Studio. To connect to a streaming data source, you should have real time package installed and Design Studio 1.4.
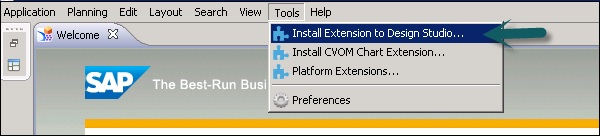
You can download these from SAP Marketplace. To install Real time package, go to Tools → Install Extension to Design Studio.
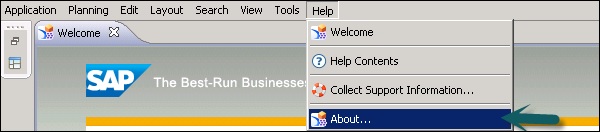
You can check real time functionality by going to the Help tab.
Along with the real time package, you need SAP Enterprise streaming package ESP SP9.
Create a Time-Based Line on Real Time Streaming
Time based line charts can handle null values if there is break in data as compared to the standard line charts.
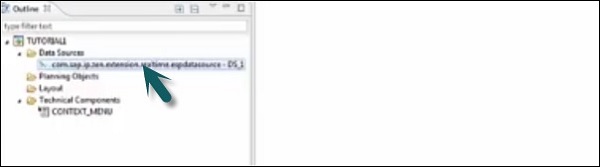
Your streaming data source is also configured and connected to ESP.
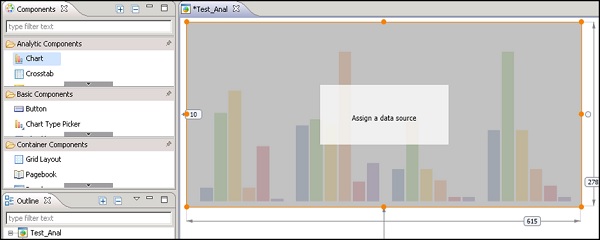
Add your chart component to the editor area in the Design Studio.
Drag the data source to the chart as shown in the following screenshot.
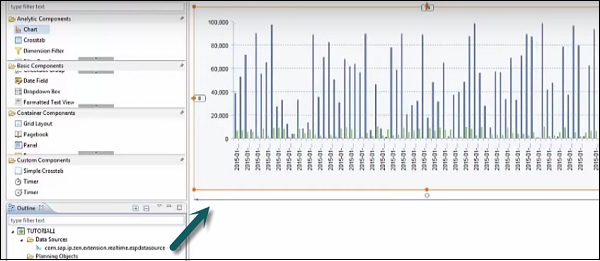
You can go to the chart type to select Additional charts from the drop down list.

