 Data Structure
 Networking
 RDBMS
RDBMS Operating System
 Java
Java MS Excel
 iOS
iOS HTML
HTML CSS
CSS Android
 Python
 C Programming
 C++
C++ C#
C# MongoDB
 MySQL
MySQL Javascript
 PHP
PHP
- Selected Reading
- UPSC IAS Exams Notes
- Developer's Best Practices
- Questions and Answers
- Effective Resume Writing
- HR Interview Questions
- Computer Glossary
- Who is Who
Choropleth maps using Plotly in Python
A choropleth map is a map that displays data on geographic regions using different colors or shades to represent values. The data is usually represented as a color scale, with darker colors indicating higher values and lighter colors indicating lower values. Choropleth maps are useful for visualizing data on a map, such as demographic data, election results, or economic indicators.
Plotly is a Python data visualization library that allows users to create interactive plots and charts. It offers a range of features for creating custom visualizations, including line charts, scatterplots, bar charts, and choropleth maps. Plotly is widely used in data science, finance, and academia.
In this tutorial, we will discuss how to create choropleth maps using Plotly, a popular Python data visualization library.
Step 1: Installing Plotly
Before we can start creating choropleth maps using Plotly, we need to install the library. We can do this using the following command in the terminal:
pip install plotly
Step 2: Load the Data
The next step in creating a choropleth map is to load the data into a Pandas DataFrame. In the example below, we will use the Gapminder dataset, which contains data on life expectancy, GDP per capita, and population for different countries over time.
import pandas as pd
import plotly.express as px
df = px.data.gapminder()
The px.data.gapminder() function loads the Gapminder dataset into a Pandas DataFrame. The DataFrame contains data for each country in each year from 1952 to 2007.
Step 3: Create the Choropleth Map
The next step is to create the choropleth map using the choropleth function from Plotly Express.
fig = px.choropleth(df, locations="iso_alpha",
   color="gdpPercap",
   hover_name="country",
   animation_frame="year",
   projection="natural earth")
The px.choropleth() function creates a choropleth map using the DataFrame df. The locations parameter specifies the column in the DataFrame that contains the ISO 3166-1 alpha-3 country codes.
The color parameter specifies the column in the DataFrame that contains the data that will be represented by color. In this case, we are using the gdpPercap column, which contains the GDP per capita data.
The hover_name parameter specifies the column in the DataFrame that contains the names of the countries, which will be displayed when the user hovers over a country on the map.
The animation_frame parameter specifies the column in the DataFrame that will be used to create an animated choropleth map. In this case, we are using the year column. Finally, the projection parameter specifies the type of map projection to use. In this case, we are using the "natural earth" projection.
Step 4: Display the Choropleth Map
The final step is to display the choropleth map using the show function.
fig.show()
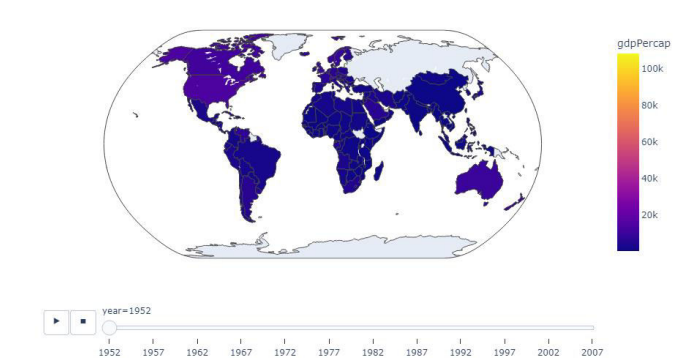
This will display the choropleth map in the Plotly visualization window as follows

Plotly allows users to customize the choropleth map in various ways. Here are some examples
Changing the Color Scale
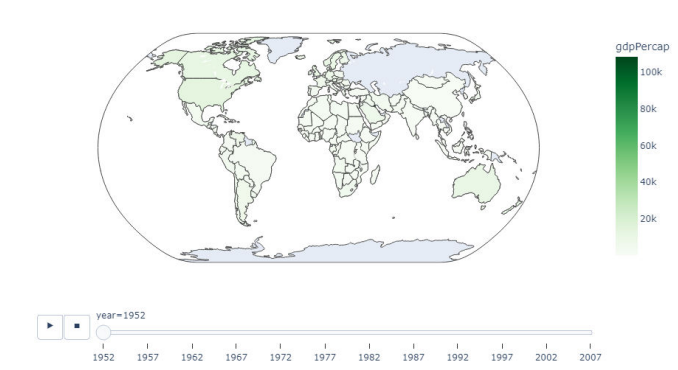
The default color scale used by Plotly is a gradient from blue to red. However, users can change the color scale to any color scheme they prefer using the color_continuous_scale parameter. For example, the following code changes the color scale to a green color scheme
fig = px.choropleth(
    df, locations="iso_alpha",
    color="gdpPercap", hover_name="country",
    animation_frame="year", projection="natural earth",
    color_continuous_scale=px.colors.sequential.Greens
)
This will display the choropleth map in the Plotly visualization window as follows

Adding a Color Bar
The color_continuous_scale parameter also allows users to add a color bar to the choropleth map. The color bar displays the range of values represented by each color on the map. To add a color bar, set the color_continuous_scale parameter to a color scale and set the color_continuous_midpoint parameter to a value within the range of the data. For example
fig = px.choropleth(df, locations="iso_alpha",
   color="gdpPercap",
   hover_name="country",
   animation_frame="year",
   projection="natural earth",
   color_continuous_scale=px.colors.sequential.Greens,
   color_continuous_midpoint=10000)
fig.update_layout(coloraxis_colorbar=dict(title="GDP per Capita"))
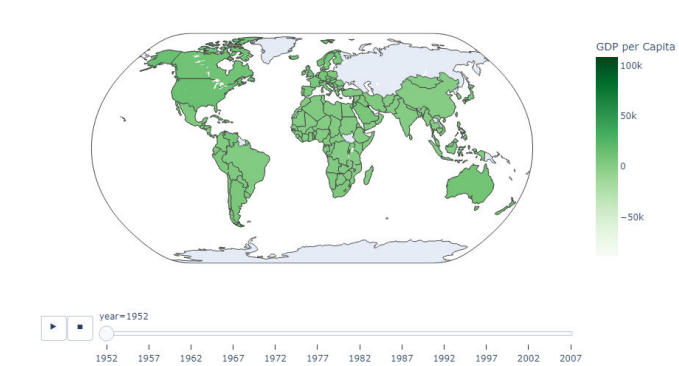
The color_continuous_midpoint parameter sets the midpoint of the color scale, which is the value that corresponds to the middle color in the color bar. The update_layout function is used to customize the color bar. In this case, we set the title of the color bar to "GDP per Capita".
This will display the choropleth map in the Plotly visualization window as follows

Adding a Title and Labels
Users can add a title and labels to the choropleth map using the title, xaxis_title, and yaxis_title parameters. For example
fig = px.choropleth(df, locations="iso_alpha",
   color="gdpPercap",
   hover_name="country",
   animation_frame="year",
   projection="natural earth",
   color_continuous_scale=px.colors.sequential.Greens,
   color_continuous_midpoint=10000,
   title="GDP per Capita by Country (1952-2007)",
   labels={"gdpPercap": "GDP per Capita", "year": "Year"})
fig.update_layout(title_x=0.5)
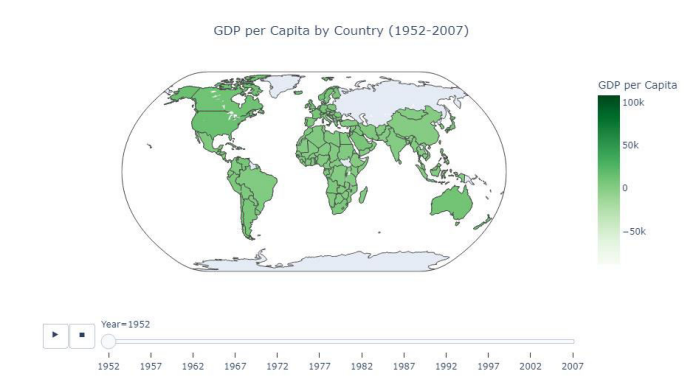
This will display the choropleth map in the Plotly visualization window as follows

The title parameter sets the title of the choropleth map, and the labels parameter sets thelabels of the X-axis and Y-axis. The update_layout function is used to customize the layout of the plot. In this case, we set the horizontal alignment of the title to the center using the title_x parameter.
Conclusion
Creating choropleth maps using Plotly is a straightforward process, and it provides anexcellent way to represent data v isually. By following the guidelines outlined in this tutorial, users can create choropleth maps that are informative, visually appealing, and customized to their specific needs.
Choropleth maps are an excellent way to present data in a meaningful way, and they are an essential tool for researchers, data analysts, and others who deal with geographic data on a regular basis

