 Data Structure
 Networking
 RDBMS
RDBMS Operating System
 Java
Java MS Excel
 iOS
iOS HTML
HTML CSS
CSS Android
 Python
 C Programming
 C++
C++ C#
C# MongoDB
 MySQL
MySQL Javascript
 PHP
PHP
- Selected Reading
- UPSC IAS Exams Notes
- Developer's Best Practices
- Questions and Answers
- Effective Resume Writing
- HR Interview Questions
- Computer Glossary
- Who is Who
Geographical plotting using Python plotly
Python provides various libraries to handle geographical and graph data. Python plotly is one of those libraries which are used to draw geographical graphs. Plotly is a free and open source library. Plotly helps to plot various kinds of graphs like Line charts, Horizontal bar charts, bar charts, dashboards, scatter plots, bubble charts, pie charts and many more.
# Import important python geographical libraries.
import plotly.plotly as py
import plotly.graph_objs as go
import pandas as pd
# Must enable in order to use plotly off-line.
from plotly.offline import download_plotlyjs, init_notebook_mode, iplot, plot
# To establish connection
init_notebook_mode()
# type defined is choropleth to
# plot geographical plots
data = dict(type = 'choropleth',
# location: LosAngles, NewJersey, Texas
locations = ['AK', 'AS', 'AZ', 'AR', 'CA', 'CO', 'CT', 'DE', 'DC', 'FM', 'FL', 'GA', 'GU', 'HI', 'ID', 'IL','IN','IA', 'KS', 'KY'],
# States of USA
locationmode = 'USA-states',
# colorscale can be added as per requirement
colorscale = 'Portland',
# text can be given anything you like
text = ['state 1', 'state 2', 'state 3', 'state 4', 'state 5','state 6', 'state 7', 'state 8', 'state 9', 'state 10','state 11', 'state 12', 'state 13', 'state 14', 'state 15','state 16', 'state 17', 'state 18', 'state 19', 'state 20'],
z = [1.0, 2.0, 3.0, 4.0, 5.0, 6.0, 7.0, 8.0, 9.0, 10.0, 11.0, 12.0, 13.0, 14.0, 15.0, 16.0, 17.0, 18.0, 19.0, 20.0],
colorbar = {'title': 'USA-states'})
layout = dict(geo ={'scope': 'usa'})
# passing data dictionary as a list
choromap = go.Figure(data = [data], layout = layout)
# plotting graph
iplot(choromap)
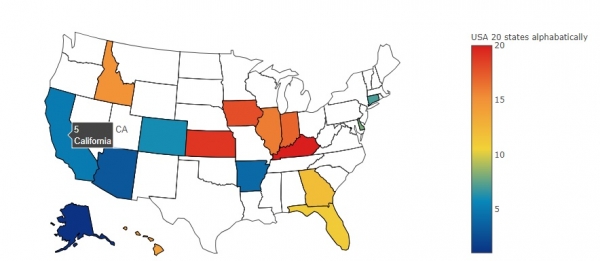
Output

With the help of the plot, we can visualize the data (input items) with different ways based on what we want to achieve. We can visualize the different states of India (29) with different colors based on what political party is ruling it or based on food choices (veg/non-veg) which states prefer what kind of food or any other thing you image. Plotly provides a very powerful and interactive library to visualize data in an easily understandable way (graph).

