- Matplotlib - Home
- Matplotlib - Introduction
- Matplotlib - Vs Seaborn
- Matplotlib - Environment Setup
- Matplotlib - Anaconda distribution
- Matplotlib - Jupyter Notebook
- Matplotlib - Pyplot API
- Matplotlib - Simple Plot
- Matplotlib - Saving Figures
- Matplotlib - Markers
- Matplotlib - Figures
- Matplotlib - Styles
- Matplotlib - Legends
- Matplotlib - Colors
- Matplotlib - Colormaps
- Matplotlib - Colormap Normalization
- Matplotlib - Choosing Colormaps
- Matplotlib - Colorbars
- Matplotlib - Working With Text
- Matplotlib - Text properties
- Matplotlib - Subplot Titles
- Matplotlib - Images
- Matplotlib - Image Masking
- Matplotlib - Annotations
- Matplotlib - Arrows
- Matplotlib - Fonts
- Matplotlib - Font Indexing
- Matplotlib - Font Properties
- Matplotlib - Scales
- Matplotlib - LaTeX
- Matplotlib - LaTeX Text Formatting in Annotations
- Matplotlib - PostScript
- Matplotlib - Mathematical Expressions
- Matplotlib - Animations
- Matplotlib - Celluloid Library
- Matplotlib - Blitting
- Matplotlib - Toolkits
- Matplotlib - Artists
- Matplotlib - Styling with Cycler
- Matplotlib - Paths
- Matplotlib - Path Effects
- Matplotlib - Transforms
- Matplotlib - Ticks and Tick Labels
- Matplotlib - Radian Ticks
- Matplotlib - Dateticks
- Matplotlib - Tick Formatters
- Matplotlib - Tick Locators
- Matplotlib - Basic Units
- Matplotlib - Autoscaling
- Matplotlib - Reverse Axes
- Matplotlib - Logarithmic Axes
- Matplotlib - Symlog
- Matplotlib - Unit Handling
- Matplotlib - Ellipse with Units
- Matplotlib - Spines
- Matplotlib - Axis Ranges
- Matplotlib - Axis Scales
- Matplotlib - Axis Ticks
- Matplotlib - Formatting Axes
- Matplotlib - Axes Class
- Matplotlib - Twin Axes
- Matplotlib - Figure Class
- Matplotlib - Multiplots
- Matplotlib - Grids
- Matplotlib - Object-oriented Interface
- Matplotlib - PyLab module
- Matplotlib - Subplots() Function
- Matplotlib - Subplot2grid() Function
- Matplotlib - Anchored Artists
- Matplotlib - Manual Contour
- Matplotlib - Coords Report
- Matplotlib - AGG filter
- Matplotlib - Ribbon Box
- Matplotlib - Fill Spiral
- Matplotlib - Findobj Method
- Matplotlib - Hyperlinks
- Matplotlib - Image Thumbnail
- Matplotlib - Plotting with Keywords
- Matplotlib - Create Logo
- Matplotlib - Multipage PDF
- Matplotlib - Multiprocessing
- Matplotlib - Print Stdout
- Matplotlib - Compound Path
- Matplotlib - Sankey Class
- Matplotlib - MRI with EEG
- Matplotlib - Stylesheets
- Matplotlib - Background Colors
- Matplotlib - Basemap
Matplotlib Events
- Matplotlib - Event Handling
- Matplotlib - Close Event
- Matplotlib - Mouse Move
- Matplotlib - Click Events
- Matplotlib - Scroll Event
- Matplotlib - Keypress Event
- Matplotlib - Pick Event
- Matplotlib - Looking Glass
- Matplotlib - Path Editor
- Matplotlib - Poly Editor
- Matplotlib - Timers
- Matplotlib - Viewlims
- Matplotlib - Zoom Window
Matplotlib Widgets
- Matplotlib - Cursor Widget
- Matplotlib - Annotated Cursor
- Matplotlib - Button Widget
- Matplotlib - Check Buttons
- Matplotlib - Lasso Selector
- Matplotlib - Menu Widget
- Matplotlib - Mouse Cursor
- Matplotlib - Multicursor
- Matplotlib - Polygon Selector
- Matplotlib - Radio Buttons
- Matplotlib - RangeSlider
- Matplotlib - Rectangle Selector
- Matplotlib - Ellipse Selector
- Matplotlib - Slider Widget
- Matplotlib - Span Selector
- Matplotlib - Textbox
Matplotlib Plotting
- Matplotlib - Line Plots
- Matplotlib - Area Plots
- Matplotlib - Bar Graphs
- Matplotlib - Histogram
- Matplotlib - Pie Chart
- Matplotlib - Scatter Plot
- Matplotlib - Box Plot
- Matplotlib - Arrow Demo
- Matplotlib - Fancy Boxes
- Matplotlib - Zorder Demo
- Matplotlib - Hatch Demo
- Matplotlib - Mmh Donuts
- Matplotlib - Ellipse Demo
- Matplotlib - Bezier Curve
- Matplotlib - Bubble Plots
- Matplotlib - Stacked Plots
- Matplotlib - Table Charts
- Matplotlib - Polar Charts
- Matplotlib - Hexagonal bin Plots
- Matplotlib - Violin Plot
- Matplotlib - Event Plot
- Matplotlib - Heatmap
- Matplotlib - Stairs Plots
- Matplotlib - Errorbar
- Matplotlib - Hinton Diagram
- Matplotlib - Contour Plot
- Matplotlib - Wireframe Plots
- Matplotlib - Surface Plots
- Matplotlib - Triangulations
- Matplotlib - Stream plot
- Matplotlib - Ishikawa Diagram
- Matplotlib - 3D Plotting
- Matplotlib - 3D Lines
- Matplotlib - 3D Scatter Plots
- Matplotlib - 3D Contour Plot
- Matplotlib - 3D Bar Plots
- Matplotlib - 3D Wireframe Plot
- Matplotlib - 3D Surface Plot
- Matplotlib - 3D Vignettes
- Matplotlib - 3D Volumes
- Matplotlib - 3D Voxels
- Matplotlib - Time Plots and Signals
- Matplotlib - Filled Plots
- Matplotlib - Step Plots
- Matplotlib - XKCD Style
- Matplotlib - Quiver Plot
- Matplotlib - Stem Plots
- Matplotlib - Visualizing Vectors
- Matplotlib - Audio Visualization
- Matplotlib - Audio Processing
Matplotlib Useful Resources
- Matplotlib - Quick Guide
- Matplotlib - Cheatsheet
- Matplotlib - Useful Resources
- Matplotlib - Discussion
Matplotlib - Audio Visualization
Audio visualization is a way to see sound. When you listen to music or any other sound, there are patterns in the sound waves. Audio visualization takes these patterns and turns them into something you can see, like colorful shapes or moving lines.
It helps you understand the rhythm, pitch, and intensity of the sound by representing it visually. Imagine watching your favorite song as it plays, and seeing colorful patterns dancing along with the beat - that is audio visualization −
Audio Visualization in Matplotlib
Audio visualization using Matplotlib is a way to see and understand sound in a graphical format. Just like how we can draw pictures to represent data, we can use Matplotlib to create visual representations of audio, making it easier to analyze and interpret.
Imagine you are looking at a graph where one side represents time, and the other side represents how loud or quiet the sound is at each moment. When you play a song or speak into a microphone, the graph will show peaks and valleys that correspond to the changes in volume over time. This graph is called a waveform, and it gives us a visual understanding of the sound's intensity and duration.
Matplotlib does not have built-in functionalities for audio visualization. However, you can use it in conjunction with other libraries such as NumPy, librosa, and scipy to perform audio visualization tasks, allowing us to see the shape of the sound and how it changes over time. By examining these visual representations, we can identify patterns, compare different sounds, and even spot anomalies in the audio data.
Install librosa
pip install librosa

Collecting librosa
...
Successfully installed audioop-lts-0.2.2 audioread-3.1.0 lazy_loader-0.4 librosa-0.11.0 llvmlite-0.46.0 msgpack-1.1.2 numba-0.63.1 numpy-2.3.5 pooch-1.8.2 soundfile-0.13.1 soxr-1.0.0 standard-aifc-3.13.0 standard-chunk-3.13.0 standard-sunau-3.13.0
Example - Audio Visualization: Mel Spectrogram
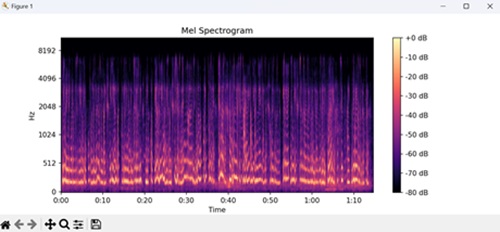
In Matplotlib, an audio visualization Mel spectrogram is a graphical representation of the frequencies in an audio signal over time, using a Mel scale. The Mel scale is a perceptual scale of pitches that approximates the human ear's response to different frequencies. It divides the audible frequency range into a set of perceptually uniform intervals.
The Mel spectrogram displays time on the x-axis, frequency on the y-axis, and the intensity of each frequency at a specific moment as a color or grayscale shade. Brighter colors or lighter shades usually indicate higher intensity or amplitude of frequencies, while darker colors or shades represent lower intensity.
Mel spectrograms are commonly used in audio processing and analysis, particularly in speech recognition and music processing applications, as they provide a more accurate representation of how humans perceive sound.
In the following example, we visualize the Mel spectrogram of an audio file using librosa and Matplotlib. We load the audio file and compute its Mel spectrogram using librosa's melspectrogram() function. We then use Matplotlib to display the spectrogram, with the color intensity representing the power in decibels −
import matplotlib.pyplot as plt
import librosa.display
import numpy as np

# Loading audio file
audio_file = "audio_file.wav"
y, sr = librosa.load(audio_file)

# Calculating the mel spectrogram of the audio
S = librosa.feature.melspectrogram(y=y, sr=sr)

# Plotting mel spectrogram
plt.figure(figsize=(10, 4))
# Displaying the mel spectrogram
librosa.display.specshow(librosa.power_to_db(S, ref=np.max), sr=sr, x_axis='time', y_axis='mel')
# Adding a colorbar to the plot with dB format
plt.colorbar(format='%+2.0f dB')
plt.title('Mel Spectrogram')
# Displaying the plot
plt.show()
Output
Following is the output of the above code −
Example - Audio Visualization: Chromagram
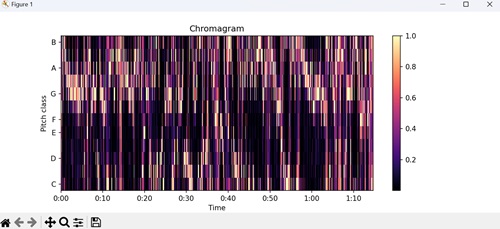
In Matplotlib, an audio visualization chromagram is a graphical representation of the pitch content in an audio signal over time, focusing on musical notes or harmonics.
The chromagram displays time on the x-axis and musical pitch classes on the y-axis, usually represented as semitones or octaves. Each point in the chromagram indicates the presence or strength of a particular pitch class at a specific moment in time, typically shown as a color or grayscale shade.
Chromagrams are commonly used in music analysis and audio processing to identify musical patterns, chords, and key signatures within audio recordings.
In this example, we are visualizing the chromagram of an audio file using librosa and Matplotlib. We load the audio file and compute its chromagram, representing pitch classes over time using librosa's chroma_stft() function. Then, we use Matplotlib to display the chromagram, with a color bar indicating intensity −
import matplotlib.pyplot as plt
import librosa.display

# Loading audio file
audio_file = "audio_file.wav"
y, sr = librosa.load(audio_file)

# Calculating the chromagram of the audio
chromagram = librosa.feature.chroma_stft(y=y, sr=sr)

# Plotting chromagram
plt.figure(figsize=(10, 4))
# Displaying the mel chromagram
librosa.display.specshow(chromagram, x_axis='time', y_axis='chroma')
# Adding a colorbar to the plot
plt.colorbar()
plt.title('Chromagram')
# Displaying the plot
plt.show()
Output
Following is the output of the above code −
Example - Audio Processing: Beat Tracker
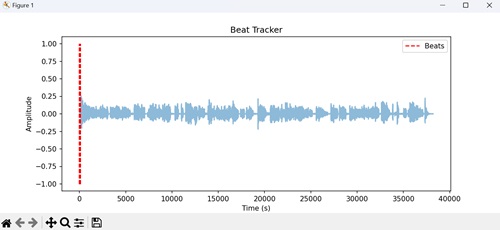
In Matplotlib, an audio processing beat tracker is a tool used to detect and visualize the rhythmic structure or tempo of an audio signal.
The beat tracker generally analyzes the audio signal to detect recurring patterns or accents in the sound, indicating the beat positions. It then generates a visualization, often as a plot, showing the detected beats or tempo changes over time.
In here, we visualize the beat positions detected in an audio file using librosa and Matplotlib. We load the audio file, and compute its tempo and beat positions using librosa's beat_track() function. We then use Matplotlib to plot the audio waveform with beat positions marked as vertical dashed red lines −
import matplotlib.pyplot as plt
import librosa.display
import numpy as np

# Loading audio file
audio_file = "audio_file.wav"
y, sr = librosa.load(audio_file)

# Calculating tempo and beat positions
tempo, beat_frames = librosa.beat.beat_track(y=y, sr=sr)

# Plotting beat positions
plt.figure(figsize=(10, 4))
# Plotting the audio waveform with transparency
plt.plot(librosa.frames_to_time(np.arange(len(y)), sr=sr), y, alpha=0.5)
# Adding vertical lines at beat positions
plt.vlines(librosa.frames_to_time(beat_frames, sr=sr), -1, 1, color='r', linestyle='--', label='Beats')
plt.xlabel("Time (s)")
plt.ylabel("Amplitude")
plt.title("Beat Tracker")
plt.legend()
# Displaying the plot
plt.show()
Output
Following is the output of the above code −