 Data Structure
 Networking
 RDBMS
RDBMS Operating System
 Java
Java MS Excel
 iOS
iOS HTML
HTML CSS
CSS Android
 Python
 C Programming
 C++
C++ C#
C# MongoDB
 MySQL
MySQL Javascript
 PHP
PHP
- Selected Reading
- UPSC IAS Exams Notes
- Developer's Best Practices
- Questions and Answers
- Effective Resume Writing
- HR Interview Questions
- Computer Glossary
- Who is Who
Filling area chart using plotly in Python
Plotly is a library in Python which is very useful in plotting various kinds of graphs and charts. It is an interactive visualization library used to create quality graphs for publications. Somes of the graphs and charts that can be visualized with plotly include line plots, scatter plots, area charts, bar charts, error bars, box plots, histograms, heatmaps, subplots, multiple-axes, polar charts, and bubble charts.
Filled Area Chart
Filled area plot is an enhanced module in plotly that analyzes a variety of data and produces user friendly figures that are easily readable. The filled area harmonizes with a particular value which corresponds to a particular column given by the line_group parameter.
Dataframes
For plotting , you need a dataframe with attributes(column names) which is usually created using pandas object and numpy or the module by itself offers certain inbuilt datasets which are mentioned below ?
carshare
election
Gapminder
iris
tips
Wind
Each of them have ai
Parameter
x,y ? refers to the name of a column in the data frame. Values of x and y are marked along their positions in the cartesian coordinates.
Color ? refers to the name of a column in the data frame. Values of this column are used to assign colours to the marked positions.
Example 1
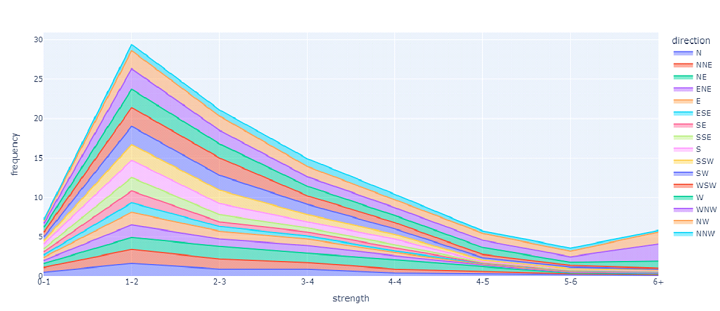
Let us visualize the wind dataset by plotting strength against frequency with direction as color. The following code prints the dataset along with its attributes, number of rows and columns.
Algorithm
Step 1 ? import plotly.express as px
Step 2 ? create a dataframe object from the wind dataset.
Step 3 ? Plot an area chart of the dataframe with the parameters x as strength, y as frequency and color as direction.
Step 4 ? show the area chart.
import plotly.express as px
df = px.data.wind()
fig = px.area(df, x="strength", y="frequency", color="direction",)
fig.show()
Output

Example 2
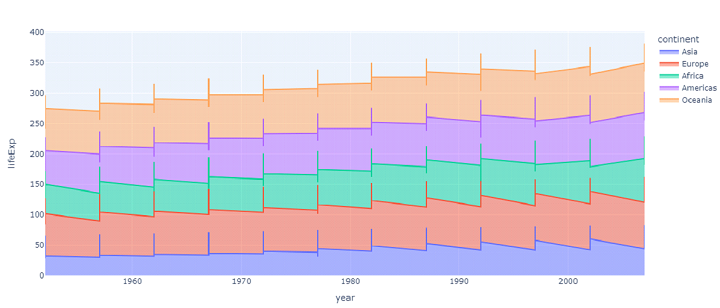
The following code prints the dataset along with its attributes, number of rows and columns by visualizing the gapminder dataset and plotting lifeExp against year with the continent as color.
Algorithm
Step 1 ? import plotly.express as px
Step 2 ? create a dataframe object from the gapminder dataset.
Step 3 ? Plot an area chart of the dataframe with the parameters x as year, y as lifeExp and color as continent.
Step 4 ? show the area chart.
import plotly.express as px
df = px.data.gapminder()
fig = px.area(df, x="year", y="lifeExp", color="continent")
fig.show()
Output

Example 3
The following code prints the dataset created with random numbers, generated by the random.randint function, along with its attributes, number of rows and columns.
Algorithm
Step 1 ? import plotly.express as px
Step 2 ? create a dataframe object using the dataset generated using randint function.
Step 3 ? Plot an area chart of the dataframe with the parameters x as year, y as lifeExp and color as continent.
Step 4 ? show the area chart.
import plotly.express as px
import numpy as np

# creating random data through randomint
# function of numpy.random
np.random.seed(50)

random_x= np.random.randint(1,100,50)
random_y= np.random.randint(1,100,50)
print(random_x)
print(random_y)
fig = px.area(x = random_x, y = random_y)
fig.show()

print(random_x)
print(random_y)
Output
[49 97 12 34 95  5 71 71 23  6  3 96 72 69 79 36 93 92 27 91  7 21 44 32
 50 86 42 65  7 20  3 80 31 36 27 61 67 77 97 68  3 11 52  1 94 94 95  1
 12 31]
[27 72 52 29 25 92 47 63 14 72 37  1 59 44 65 20 59 46 84  2 62 10 30 53
 44 88 33 20 48 70 93  7 66 37 85 37 45 54 79  5 87 44 20 97 38 31 63 45
 44 36]
Conclusion
The area visualized by plotly library has two main variations namely stacked and unstacked area. The basic area is amplified to display an enormous number of values. However, the stacked area plot is considered one of the best ways of representation of data in bar graphs or charts.

