- Matplotlib - Home
- Matplotlib - Introduction
- Matplotlib - Vs Seaborn
- Matplotlib - Environment Setup
- Matplotlib - Anaconda distribution
- Matplotlib - Jupyter Notebook
- Matplotlib - Pyplot API
- Matplotlib - Simple Plot
- Matplotlib - Saving Figures
- Matplotlib - Markers
- Matplotlib - Figures
- Matplotlib - Styles
- Matplotlib - Legends
- Matplotlib - Colors
- Matplotlib - Colormaps
- Matplotlib - Colormap Normalization
- Matplotlib - Choosing Colormaps
- Matplotlib - Colorbars
- Matplotlib - Working With Text
- Matplotlib - Text properties
- Matplotlib - Subplot Titles
- Matplotlib - Images
- Matplotlib - Image Masking
- Matplotlib - Annotations
- Matplotlib - Arrows
- Matplotlib - Fonts
- Matplotlib - Font Indexing
- Matplotlib - Font Properties
- Matplotlib - Scales
- Matplotlib - LaTeX
- Matplotlib - LaTeX Text Formatting in Annotations
- Matplotlib - PostScript
- Matplotlib - Mathematical Expressions
- Matplotlib - Animations
- Matplotlib - Celluloid Library
- Matplotlib - Blitting
- Matplotlib - Toolkits
- Matplotlib - Artists
- Matplotlib - Styling with Cycler
- Matplotlib - Paths
- Matplotlib - Path Effects
- Matplotlib - Transforms
- Matplotlib - Ticks and Tick Labels
- Matplotlib - Radian Ticks
- Matplotlib - Dateticks
- Matplotlib - Tick Formatters
- Matplotlib - Tick Locators
- Matplotlib - Basic Units
- Matplotlib - Autoscaling
- Matplotlib - Reverse Axes
- Matplotlib - Logarithmic Axes
- Matplotlib - Symlog
- Matplotlib - Unit Handling
- Matplotlib - Ellipse with Units
- Matplotlib - Spines
- Matplotlib - Axis Ranges
- Matplotlib - Axis Scales
- Matplotlib - Axis Ticks
- Matplotlib - Formatting Axes
- Matplotlib - Axes Class
- Matplotlib - Twin Axes
- Matplotlib - Figure Class
- Matplotlib - Multiplots
- Matplotlib - Grids
- Matplotlib - Object-oriented Interface
- Matplotlib - PyLab module
- Matplotlib - Subplots() Function
- Matplotlib - Subplot2grid() Function
- Matplotlib - Anchored Artists
- Matplotlib - Manual Contour
- Matplotlib - Coords Report
- Matplotlib - AGG filter
- Matplotlib - Ribbon Box
- Matplotlib - Fill Spiral
- Matplotlib - Findobj Method
- Matplotlib - Hyperlinks
- Matplotlib - Image Thumbnail
- Matplotlib - Plotting with Keywords
- Matplotlib - Create Logo
- Matplotlib - Multipage PDF
- Matplotlib - Multiprocessing
- Matplotlib - Print Stdout
- Matplotlib - Compound Path
- Matplotlib - Sankey Class
- Matplotlib - MRI with EEG
- Matplotlib - Stylesheets
- Matplotlib - Background Colors
- Matplotlib - Basemap
Matplotlib Events
- Matplotlib - Event Handling
- Matplotlib - Close Event
- Matplotlib - Mouse Move
- Matplotlib - Click Events
- Matplotlib - Scroll Event
- Matplotlib - Keypress Event
- Matplotlib - Pick Event
- Matplotlib - Looking Glass
- Matplotlib - Path Editor
- Matplotlib - Poly Editor
- Matplotlib - Timers
- Matplotlib - Viewlims
- Matplotlib - Zoom Window
Matplotlib Widgets
- Matplotlib - Cursor Widget
- Matplotlib - Annotated Cursor
- Matplotlib - Button Widget
- Matplotlib - Check Buttons
- Matplotlib - Lasso Selector
- Matplotlib - Menu Widget
- Matplotlib - Mouse Cursor
- Matplotlib - Multicursor
- Matplotlib - Polygon Selector
- Matplotlib - Radio Buttons
- Matplotlib - RangeSlider
- Matplotlib - Rectangle Selector
- Matplotlib - Ellipse Selector
- Matplotlib - Slider Widget
- Matplotlib - Span Selector
- Matplotlib - Textbox
Matplotlib Plotting
- Matplotlib - Line Plots
- Matplotlib - Area Plots
- Matplotlib - Bar Graphs
- Matplotlib - Histogram
- Matplotlib - Pie Chart
- Matplotlib - Scatter Plot
- Matplotlib - Box Plot
- Matplotlib - Arrow Demo
- Matplotlib - Fancy Boxes
- Matplotlib - Zorder Demo
- Matplotlib - Hatch Demo
- Matplotlib - Mmh Donuts
- Matplotlib - Ellipse Demo
- Matplotlib - Bezier Curve
- Matplotlib - Bubble Plots
- Matplotlib - Stacked Plots
- Matplotlib - Table Charts
- Matplotlib - Polar Charts
- Matplotlib - Hexagonal bin Plots
- Matplotlib - Violin Plot
- Matplotlib - Event Plot
- Matplotlib - Heatmap
- Matplotlib - Stairs Plots
- Matplotlib - Errorbar
- Matplotlib - Hinton Diagram
- Matplotlib - Contour Plot
- Matplotlib - Wireframe Plots
- Matplotlib - Surface Plots
- Matplotlib - Triangulations
- Matplotlib - Stream plot
- Matplotlib - Ishikawa Diagram
- Matplotlib - 3D Plotting
- Matplotlib - 3D Lines
- Matplotlib - 3D Scatter Plots
- Matplotlib - 3D Contour Plot
- Matplotlib - 3D Bar Plots
- Matplotlib - 3D Wireframe Plot
- Matplotlib - 3D Surface Plot
- Matplotlib - 3D Vignettes
- Matplotlib - 3D Volumes
- Matplotlib - 3D Voxels
- Matplotlib - Time Plots and Signals
- Matplotlib - Filled Plots
- Matplotlib - Step Plots
- Matplotlib - XKCD Style
- Matplotlib - Quiver Plot
- Matplotlib - Stem Plots
- Matplotlib - Visualizing Vectors
- Matplotlib - Audio Visualization
- Matplotlib - Audio Processing
Matplotlib Useful Resources
- Matplotlib - Quick Guide
- Matplotlib - Cheatsheet
- Matplotlib - Useful Resources
- Matplotlib - Discussion
Matplotlib - Images
What are Images in Matplotlib?
In Matplotlib library displaying and manipulating images involves using the imshow() function. This function visualizes 2D arrays or images. This function is particularly useful for showing images in various formats such as arrays representing pixel values or actual image files.
Images in Matplotlib provide a way to visualize gridded data, facilitating the interpretation and analysis of information represented in 2D arrays. This capability is crucial for various scientific, engineering and machine learning applications that deal with image data.
Use Cases for Images in Matplotlib
The following are the use cases of Images in Matplotlib library.
Visualizing Gridded Data
The matplotlib library can be used for displaying scientific data such as heatmaps, terrain maps, satellite images etc.
Image Processing
Analyzing and manipulating image data in applications such as computer vision or image recognition.
Artificial Intelligence and Machine Learning
Handling and processing image data in training and evaluation of models.
Loading and Displaying Images
To load and display an image using Matplotlib library we can use the following lines of code.
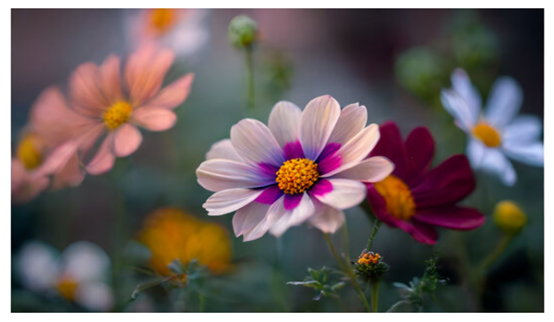
Example - Loading Images in Plots
import matplotlib.pyplot as plt
import matplotlib.image as mpimg

# Load the image
img = mpimg.imread('Images/flowers.jpg')  # Load image file

# Display the image
plt.imshow(img)
plt.axis('off')  # Turn off axis labels and ticks (optional)
plt.show()
Output
Key Points of the above code
matplotlib.image.imread() − Loads an image file and returns it as an array. The file path ('image_path') should be specified.
plt.imshow() − Displays the image represented by the array.
plt.axis('off') − Turns off axis labels and ticks, which is optional for purely displaying the image without axes.
Customizing Image Display
We can customize the image as per the requirement by thebelow mentioned functions.
Colormap − We can apply a colormap to enhance image visualization by specifying the cmap parameter in imshow().
Colorbar − To add a colorbar indicating the intensity mapping we can use plt.colorbar() after imshow().
Example - Enhanceing Image Visualization
import matplotlib.pyplot as plt
import matplotlib.image as mpimg

# Load the image
img = mpimg.imread('Images/flowers.jpg')  # Load image file

# Display the image
plt.imshow(img, cmap = 'Oranges')
plt.colorbar()

# Turn on axis labels and ticks (optional)
plt.axis('on')
plt.show()
Output
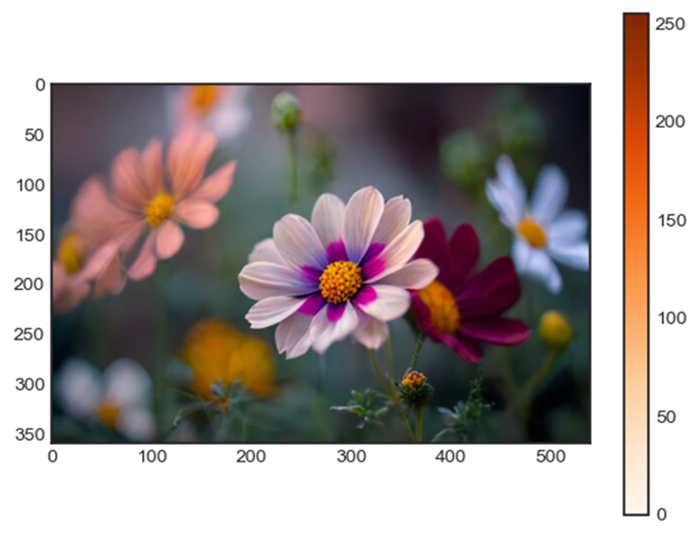
Image Manipulation
We can perform manipulation for our images by using the below mentioned functions.
Cropping − Select a specific portion of the image by slicing the array before passing it to imshow().
Resizing − Use various image processing libraries such as Pillow, OpenCV to resize images before displaying them.
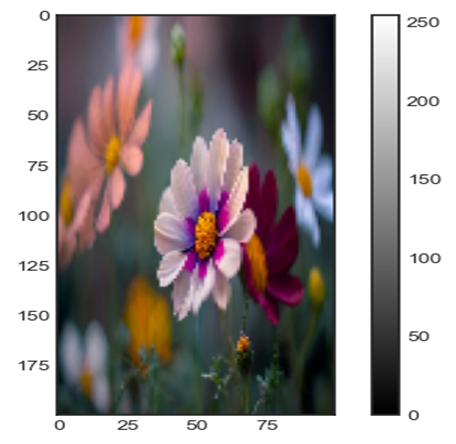
Example - Manipulating Images
In this example we are manipulating the image and displaying the image by using the above mentioned functions.
import matplotlib.pyplot as plt
import matplotlib.image as mpimg
import cv2

# Load the image
img = mpimg.imread('Images/flowers.jpg')

# Display the image with grayscale colormap and colorbar
plt.imshow(img, cmap='gray')
plt.colorbar()

# Display only a portion of the image (cropping)
plt.imshow(img[100:300, 200:400])

# Display a resized version of the image
resized_img = cv2.resize(img, (new_width, new_height))
plt.imshow(resized_img)
plt.show()
Output
Remember Matplotlib's imshow() is suitable for basic image display and visualization. For more advanced image processing tasks such as resizing, filtering, etc. using dedicated image processing libraries like OpenCV or Pillow is recommended.
