- Matplotlib - Home
- Matplotlib - Introduction
- Matplotlib - Vs Seaborn
- Matplotlib - Environment Setup
- Matplotlib - Anaconda distribution
- Matplotlib - Jupyter Notebook
- Matplotlib - Pyplot API
- Matplotlib - Simple Plot
- Matplotlib - Saving Figures
- Matplotlib - Markers
- Matplotlib - Figures
- Matplotlib - Styles
- Matplotlib - Legends
- Matplotlib - Colors
- Matplotlib - Colormaps
- Matplotlib - Colormap Normalization
- Matplotlib - Choosing Colormaps
- Matplotlib - Colorbars
- Matplotlib - Working With Text
- Matplotlib - Text properties
- Matplotlib - Subplot Titles
- Matplotlib - Images
- Matplotlib - Image Masking
- Matplotlib - Annotations
- Matplotlib - Arrows
- Matplotlib - Fonts
- Matplotlib - Font Indexing
- Matplotlib - Font Properties
- Matplotlib - Scales
- Matplotlib - LaTeX
- Matplotlib - LaTeX Text Formatting in Annotations
- Matplotlib - PostScript
- Matplotlib - Mathematical Expressions
- Matplotlib - Animations
- Matplotlib - Celluloid Library
- Matplotlib - Blitting
- Matplotlib - Toolkits
- Matplotlib - Artists
- Matplotlib - Styling with Cycler
- Matplotlib - Paths
- Matplotlib - Path Effects
- Matplotlib - Transforms
- Matplotlib - Ticks and Tick Labels
- Matplotlib - Radian Ticks
- Matplotlib - Dateticks
- Matplotlib - Tick Formatters
- Matplotlib - Tick Locators
- Matplotlib - Basic Units
- Matplotlib - Autoscaling
- Matplotlib - Reverse Axes
- Matplotlib - Logarithmic Axes
- Matplotlib - Symlog
- Matplotlib - Unit Handling
- Matplotlib - Ellipse with Units
- Matplotlib - Spines
- Matplotlib - Axis Ranges
- Matplotlib - Axis Scales
- Matplotlib - Axis Ticks
- Matplotlib - Formatting Axes
- Matplotlib - Axes Class
- Matplotlib - Twin Axes
- Matplotlib - Figure Class
- Matplotlib - Multiplots
- Matplotlib - Grids
- Matplotlib - Object-oriented Interface
- Matplotlib - PyLab module
- Matplotlib - Subplots() Function
- Matplotlib - Subplot2grid() Function
- Matplotlib - Anchored Artists
- Matplotlib - Manual Contour
- Matplotlib - Coords Report
- Matplotlib - AGG filter
- Matplotlib - Ribbon Box
- Matplotlib - Fill Spiral
- Matplotlib - Findobj Method
- Matplotlib - Hyperlinks
- Matplotlib - Image Thumbnail
- Matplotlib - Plotting with Keywords
- Matplotlib - Create Logo
- Matplotlib - Multipage PDF
- Matplotlib - Multiprocessing
- Matplotlib - Print Stdout
- Matplotlib - Compound Path
- Matplotlib - Sankey Class
- Matplotlib - MRI with EEG
- Matplotlib - Stylesheets
- Matplotlib - Background Colors
- Matplotlib - Basemap
Matplotlib Events
- Matplotlib - Event Handling
- Matplotlib - Close Event
- Matplotlib - Mouse Move
- Matplotlib - Click Events
- Matplotlib - Scroll Event
- Matplotlib - Keypress Event
- Matplotlib - Pick Event
- Matplotlib - Looking Glass
- Matplotlib - Path Editor
- Matplotlib - Poly Editor
- Matplotlib - Timers
- Matplotlib - Viewlims
- Matplotlib - Zoom Window
Matplotlib Widgets
- Matplotlib - Cursor Widget
- Matplotlib - Annotated Cursor
- Matplotlib - Button Widget
- Matplotlib - Check Buttons
- Matplotlib - Lasso Selector
- Matplotlib - Menu Widget
- Matplotlib - Mouse Cursor
- Matplotlib - Multicursor
- Matplotlib - Polygon Selector
- Matplotlib - Radio Buttons
- Matplotlib - RangeSlider
- Matplotlib - Rectangle Selector
- Matplotlib - Ellipse Selector
- Matplotlib - Slider Widget
- Matplotlib - Span Selector
- Matplotlib - Textbox
Matplotlib Plotting
- Matplotlib - Line Plots
- Matplotlib - Area Plots
- Matplotlib - Bar Graphs
- Matplotlib - Histogram
- Matplotlib - Pie Chart
- Matplotlib - Scatter Plot
- Matplotlib - Box Plot
- Matplotlib - Arrow Demo
- Matplotlib - Fancy Boxes
- Matplotlib - Zorder Demo
- Matplotlib - Hatch Demo
- Matplotlib - Mmh Donuts
- Matplotlib - Ellipse Demo
- Matplotlib - Bezier Curve
- Matplotlib - Bubble Plots
- Matplotlib - Stacked Plots
- Matplotlib - Table Charts
- Matplotlib - Polar Charts
- Matplotlib - Hexagonal bin Plots
- Matplotlib - Violin Plot
- Matplotlib - Event Plot
- Matplotlib - Heatmap
- Matplotlib - Stairs Plots
- Matplotlib - Errorbar
- Matplotlib - Hinton Diagram
- Matplotlib - Contour Plot
- Matplotlib - Wireframe Plots
- Matplotlib - Surface Plots
- Matplotlib - Triangulations
- Matplotlib - Stream plot
- Matplotlib - Ishikawa Diagram
- Matplotlib - 3D Plotting
- Matplotlib - 3D Lines
- Matplotlib - 3D Scatter Plots
- Matplotlib - 3D Contour Plot
- Matplotlib - 3D Bar Plots
- Matplotlib - 3D Wireframe Plot
- Matplotlib - 3D Surface Plot
- Matplotlib - 3D Vignettes
- Matplotlib - 3D Volumes
- Matplotlib - 3D Voxels
- Matplotlib - Time Plots and Signals
- Matplotlib - Filled Plots
- Matplotlib - Step Plots
- Matplotlib - XKCD Style
- Matplotlib - Quiver Plot
- Matplotlib - Stem Plots
- Matplotlib - Visualizing Vectors
- Matplotlib - Audio Visualization
- Matplotlib - Audio Processing
Matplotlib Useful Resources
- Matplotlib - Quick Guide
- Matplotlib - Cheatsheet
- Matplotlib - Useful Resources
- Matplotlib - Discussion
Matplotlib - Environment Setup
Matplotlib llibrary is highly compatible with various operating systems and Python environments. Setting up Matplotlib is relatively straightforward and its versatility makes it a valuable tool for visualizing data in Python. It involves ensuring that it is installed and configuring its behavior within our Python environment.
The below is the step-by-step guide to set the environment of the matplotlib library.
Installation
Matplotlib is often included in Python distributions like Anaconda. However if it's not installed we can do so using pip. The following is the command to install the matplotlib library.
pip install matplotlib
Checking the Installation
If we want to verify whether the installation is done or not then open a Python interpreter or a Jupyter Notebook and import Matplotlib library pyplot module by using the below code line.
import matplotlib.pyplot as plt
If no errors occur then the installation is successful otherwise there is a trouble in installation.
Backend Selection
Matplotlib has different "backends" responsible for rendering the plots. These backends can display figures in different environments e.g. in a Jupyter Notebook a separate window etc.
Interactive Backends (Great for Jupyter Notebook)
For enabling interactive plotting within Jupyter Notebook, we use the magic command %matplotlib. The below is the code line to be executed.
%matplotlib inline
# or
%matplotlib notebook
The %matplotlib inline command displays static images of our plot in the notebook while %matplotlib notebook allows interactive plots such as panning and zooming.
Non-Interactive Backend (when not using Jupyter)
When not working within a Jupyter environment then Matplotlib can use non-interactive backends. It automatically selects a suitable backend for our system. We can set a backend explicitly.
import matplotlib
matplotlib.use('Agg')  # Backend selection, 'Agg' for non-interactive backend
Configuration and Style
Matplotlib allows customization of default settings and styles. We can create a configuration file named `matplotlibrc` to customize the behavior.
Locating the Configuration File
To find where our Matplotlib configuration file is located we can run the below code using the Python editor.
import matplotlib
matplotlib.matplotlib_fname()
Creating/Editing Configuration
We can modify this file directly or create a new one to adjust various settings such as default figure size, line styles, fonts etc.Testing the Setup
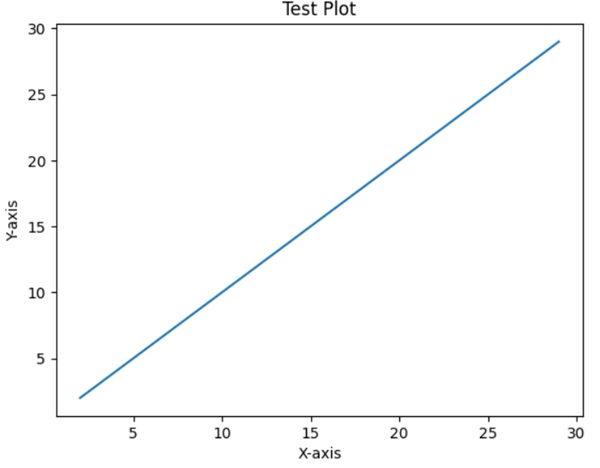
To ensure everything is set up correctly we can create a simple plot using Matplotlib.
Example
import matplotlib.pyplot as plt
x = list(range(2,30))
y = list(range(2,30))
plt.plot(x, y)
plt.xlabel('X-axis')
plt.ylabel('Y-axis')
plt.title('Test Plot')
plt.show()
Running this code should display a simple plot with a line chart in the selected environment.
Output
Incase Python 2.7 or 3.4 versions are not installed for all users, the Microsoft Visual C++ 2008 (64 bit or 32 bit forPython 2.7) or Microsoft Visual C++ 2010 (64 bit or 32 bit for Python 3.4) redistributable packages need to be installed.
If you are using Python 2.7 on a Mac, execute the following command −
xcode-select -install
Upon execution of the above command, the subprocess32 - a dependency, may be compiled.
On extremely old versions of Linux and Python 2.7, you may need to install the master version of subprocess32.
Matplotlib requires a large number of dependencies −
Python (>= 2.7 or >= 3.4)
NumPy
setuptools
dateutil
pyparsing
libpng
pytz
FreeType
cycler
six
Optionally, you can also install a number of packages to enable better user interface toolkits.
tk
PyQt4
PyQt5
pygtk
wxpython
pycairo
Tornado
For better support of animation output format and image file formats, LaTeX, etc., you can install the following −
_mpeg/avconv
ImageMagick
Pillow (>=2.0)
LaTeX and GhostScript (for rendering text with LaTeX).
LaTeX and GhostScript (for rendering text with LaTeX).
