- Matplotlib - Home
- Matplotlib - Introduction
- Matplotlib - Vs Seaborn
- Matplotlib - Environment Setup
- Matplotlib - Anaconda distribution
- Matplotlib - Jupyter Notebook
- Matplotlib - Pyplot API
- Matplotlib - Simple Plot
- Matplotlib - Saving Figures
- Matplotlib - Markers
- Matplotlib - Figures
- Matplotlib - Styles
- Matplotlib - Legends
- Matplotlib - Colors
- Matplotlib - Colormaps
- Matplotlib - Colormap Normalization
- Matplotlib - Choosing Colormaps
- Matplotlib - Colorbars
- Matplotlib - Working With Text
- Matplotlib - Text properties
- Matplotlib - Subplot Titles
- Matplotlib - Images
- Matplotlib - Image Masking
- Matplotlib - Annotations
- Matplotlib - Arrows
- Matplotlib - Fonts
- Matplotlib - Font Indexing
- Matplotlib - Font Properties
- Matplotlib - Scales
- Matplotlib - LaTeX
- Matplotlib - LaTeX Text Formatting in Annotations
- Matplotlib - PostScript
- Matplotlib - Mathematical Expressions
- Matplotlib - Animations
- Matplotlib - Celluloid Library
- Matplotlib - Blitting
- Matplotlib - Toolkits
- Matplotlib - Artists
- Matplotlib - Styling with Cycler
- Matplotlib - Paths
- Matplotlib - Path Effects
- Matplotlib - Transforms
- Matplotlib - Ticks and Tick Labels
- Matplotlib - Radian Ticks
- Matplotlib - Dateticks
- Matplotlib - Tick Formatters
- Matplotlib - Tick Locators
- Matplotlib - Basic Units
- Matplotlib - Autoscaling
- Matplotlib - Reverse Axes
- Matplotlib - Logarithmic Axes
- Matplotlib - Symlog
- Matplotlib - Unit Handling
- Matplotlib - Ellipse with Units
- Matplotlib - Spines
- Matplotlib - Axis Ranges
- Matplotlib - Axis Scales
- Matplotlib - Axis Ticks
- Matplotlib - Formatting Axes
- Matplotlib - Axes Class
- Matplotlib - Twin Axes
- Matplotlib - Figure Class
- Matplotlib - Multiplots
- Matplotlib - Grids
- Matplotlib - Object-oriented Interface
- Matplotlib - PyLab module
- Matplotlib - Subplots() Function
- Matplotlib - Subplot2grid() Function
- Matplotlib - Anchored Artists
- Matplotlib - Manual Contour
- Matplotlib - Coords Report
- Matplotlib - AGG filter
- Matplotlib - Ribbon Box
- Matplotlib - Fill Spiral
- Matplotlib - Findobj Method
- Matplotlib - Hyperlinks
- Matplotlib - Image Thumbnail
- Matplotlib - Plotting with Keywords
- Matplotlib - Create Logo
- Matplotlib - Multipage PDF
- Matplotlib - Multiprocessing
- Matplotlib - Print Stdout
- Matplotlib - Compound Path
- Matplotlib - Sankey Class
- Matplotlib - MRI with EEG
- Matplotlib - Stylesheets
- Matplotlib - Background Colors
- Matplotlib - Basemap
Matplotlib Events
- Matplotlib - Event Handling
- Matplotlib - Close Event
- Matplotlib - Mouse Move
- Matplotlib - Click Events
- Matplotlib - Scroll Event
- Matplotlib - Keypress Event
- Matplotlib - Pick Event
- Matplotlib - Looking Glass
- Matplotlib - Path Editor
- Matplotlib - Poly Editor
- Matplotlib - Timers
- Matplotlib - Viewlims
- Matplotlib - Zoom Window
Matplotlib Widgets
- Matplotlib - Cursor Widget
- Matplotlib - Annotated Cursor
- Matplotlib - Button Widget
- Matplotlib - Check Buttons
- Matplotlib - Lasso Selector
- Matplotlib - Menu Widget
- Matplotlib - Mouse Cursor
- Matplotlib - Multicursor
- Matplotlib - Polygon Selector
- Matplotlib - Radio Buttons
- Matplotlib - RangeSlider
- Matplotlib - Rectangle Selector
- Matplotlib - Ellipse Selector
- Matplotlib - Slider Widget
- Matplotlib - Span Selector
- Matplotlib - Textbox
Matplotlib Plotting
- Matplotlib - Line Plots
- Matplotlib - Area Plots
- Matplotlib - Bar Graphs
- Matplotlib - Histogram
- Matplotlib - Pie Chart
- Matplotlib - Scatter Plot
- Matplotlib - Box Plot
- Matplotlib - Arrow Demo
- Matplotlib - Fancy Boxes
- Matplotlib - Zorder Demo
- Matplotlib - Hatch Demo
- Matplotlib - Mmh Donuts
- Matplotlib - Ellipse Demo
- Matplotlib - Bezier Curve
- Matplotlib - Bubble Plots
- Matplotlib - Stacked Plots
- Matplotlib - Table Charts
- Matplotlib - Polar Charts
- Matplotlib - Hexagonal bin Plots
- Matplotlib - Violin Plot
- Matplotlib - Event Plot
- Matplotlib - Heatmap
- Matplotlib - Stairs Plots
- Matplotlib - Errorbar
- Matplotlib - Hinton Diagram
- Matplotlib - Contour Plot
- Matplotlib - Wireframe Plots
- Matplotlib - Surface Plots
- Matplotlib - Triangulations
- Matplotlib - Stream plot
- Matplotlib - Ishikawa Diagram
- Matplotlib - 3D Plotting
- Matplotlib - 3D Lines
- Matplotlib - 3D Scatter Plots
- Matplotlib - 3D Contour Plot
- Matplotlib - 3D Bar Plots
- Matplotlib - 3D Wireframe Plot
- Matplotlib - 3D Surface Plot
- Matplotlib - 3D Vignettes
- Matplotlib - 3D Volumes
- Matplotlib - 3D Voxels
- Matplotlib - Time Plots and Signals
- Matplotlib - Filled Plots
- Matplotlib - Step Plots
- Matplotlib - XKCD Style
- Matplotlib - Quiver Plot
- Matplotlib - Stem Plots
- Matplotlib - Visualizing Vectors
- Matplotlib - Audio Visualization
- Matplotlib - Audio Processing
Matplotlib Useful Resources
- Matplotlib - Quick Guide
- Matplotlib - Cheatsheet
- Matplotlib - Useful Resources
- Matplotlib - Discussion
Matplotlib - Looking Glass
A looking glass is a term often refers to an object with a reflective surface, such as a mirror, through which one can observe their own reflection or the surrounding environment.
In terms of the graphical user interfaces, the term "looking glass" is sometimes used to describe a feature that provides a detailed view or insight into a specific aspect of a system or application.
Looking Glass in Matplotlib
In the context of Matplotlib, looking glass is a GUI application or example that implements an interactive circular window that reveals or hides portions of a Matplotlib plot. This looking glass example uses the Matplotlib's patches module to create a interactive circular window. With this interactive nature allows users to explore the underlying data dynamically.
This tutorial demonstrates how to create an interactive circular window, which is similar to a looking glass, that can be moved to reveal or hide portions of a plot beneath it.
Defining and Visualizing initial plot
Start by defining a predefined looking glass using the patches.Circle() class object.
Following is the set up for the Initial plot appearance −
import matplotlib.pyplot as plt
import numpy as np
import matplotlib.patches as patches
np.random.seed(19680801)
x, y = np.random.rand(2, 200)
fig, ax = plt.subplots(figsize=(7, 4))
circle_= patches.Circle((0.5, 0.5), 0.25, alpha=0.8, fc='yellow')
ax.add_patch(circle_)
ax.plot(x, y, alpha=0.2)
line, = ax.plot(x, y, alpha=1.0, clip_path=circle_)
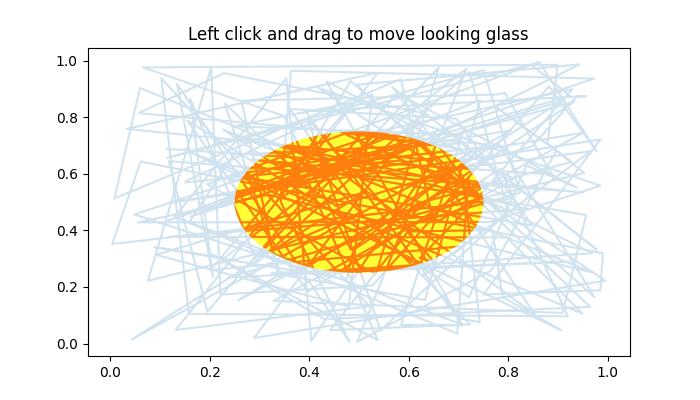
ax.set_title("Left click and drag to move looking glass")
Implementing the Looking Glass Interaction
Lets see the implementation of the EventHandler class used for creating the interactive looking glass. This class captures the mouse events, allowing users to click, drag, and reposition the looking glass.
class EventHandler:
   def __init__(self):
      # Connect event handlers to the figure canvas
      fig.canvas.mpl_connect('button_press_event', self.on_press)
      fig.canvas.mpl_connect('button_release_event', self.on_release)
      fig.canvas.mpl_connect('motion_notify_event', self.on_move)

      # Initialize the center coordinates of the circular window
      self.x0, self.y0 = circle_.center
      self.pressevent = None

   def on_press(self, event):
      # Check if the event occurred inside the plot area
      if event.inaxes != ax:
         return

      # Check if the click is inside the circular window
      if not circle_.contains(event)[0]:
         return

      # Store the press event
      self.pressevent = event

   def on_release(self, event):
      # Reset the press event and update the center coordinates
      self.pressevent = None
      self.x0, self.y0 = circle_.center

   def on_move(self, event):
      # Check if a press event has occurred and if the mouse is still inside the plot
      if self.pressevent is None or event.inaxes != self.pressevent.inaxes:
         return

      # Calculate the change in coordinates
      dx = event.xdata - self.pressevent.xdata
      dy = event.ydata - self.pressevent.ydata

      # Update the center coordinates of the circle_ular window
      circle_.center = self.x0 + dx, self.y0 + dy

      # Update the clip path and redraw the plot
      line.set_clip_path(circle_)
      fig.canvas.draw()
Running the implementation
Create an instance of the EventHandler class to create the looking glass on a plot.
handler = EventHandler()
Example - Looking Glass Implementation
Lets see the complete code of the Matplotlib Looking Glass example.
import matplotlib.pyplot as plt
import numpy as np
import matplotlib.patches as patches

np.random.seed(19680801)

# Generate random data for plot
x, y = np.random.rand(2, 200)

# Create a Matplotlib figure and axis
fig, ax = plt.subplots(figsize=(7, 4))

# Create a circular window (looking glass) and add it to the plot
circle_= patches.Circle((0.5, 0.5), 0.25, alpha=0.8, fc='yellow')
ax.add_patch(circle_)

# Plot the random data with transparency
ax.plot(x, y, alpha=0.2)

# Plot the same data again, but clip it to the circular window
line, = ax.plot(x, y, alpha=1.0, clip_path=circle_)

# Set the plot title
ax.set_title("Left click and drag to move looking glass")


class EventHandler:
   def __init__(self):
      # Connect event handlers to the figure canvas
      fig.canvas.mpl_connect('button_press_event', self.on_press)
      fig.canvas.mpl_connect('button_release_event', self.on_release)
      fig.canvas.mpl_connect('motion_notify_event', self.on_move)

      # Initialize the center coordinates of the circular window
      self.x0, self.y0 = circle_.center
      self.pressevent = None

   def on_press(self, event):
      # Check if the event occurred inside the plot area
      if event.inaxes != ax:
         return

      # Check if the click is inside the circular window
      if not circle_.contains(event)[0]:
         return

      # Store the press event
      self.pressevent = event

   def on_release(self, event):
      # Reset the press event and update the center coordinates
      self.pressevent = None
      self.x0, self.y0 = circle_.center

   def on_move(self, event):
      # Check if a press event has occurred and if the mouse is still inside the plot
      if self.pressevent is None or event.inaxes != self.pressevent.inaxes:
         return

      # Calculate the change in coordinates
      dx = event.xdata - self.pressevent.xdata
      dy = event.ydata - self.pressevent.ydata

      # Update the center coordinates of the circle_ular window
      circle_.center = self.x0 + dx, self.y0 + dy

      # Update the clip path and redraw the plot
      line.set_clip_path(circle_)
      fig.canvas.draw()

# Create an instance of the EventHandler class
handler = EventHandler()

# Display the plot
plt.show()
Output
On executing the above program you will get the following figure left click on mouse and drag the looking glass to observe the working of this example −
Watch the video below to observe the works of this example.