- Matplotlib - Home
- Matplotlib - Introduction
- Matplotlib - Vs Seaborn
- Matplotlib - Environment Setup
- Matplotlib - Anaconda distribution
- Matplotlib - Jupyter Notebook
- Matplotlib - Pyplot API
- Matplotlib - Simple Plot
- Matplotlib - Saving Figures
- Matplotlib - Markers
- Matplotlib - Figures
- Matplotlib - Styles
- Matplotlib - Legends
- Matplotlib - Colors
- Matplotlib - Colormaps
- Matplotlib - Colormap Normalization
- Matplotlib - Choosing Colormaps
- Matplotlib - Colorbars
- Matplotlib - Working With Text
- Matplotlib - Text properties
- Matplotlib - Subplot Titles
- Matplotlib - Images
- Matplotlib - Image Masking
- Matplotlib - Annotations
- Matplotlib - Arrows
- Matplotlib - Fonts
- Matplotlib - Font Indexing
- Matplotlib - Font Properties
- Matplotlib - Scales
- Matplotlib - LaTeX
- Matplotlib - LaTeX Text Formatting in Annotations
- Matplotlib - PostScript
- Matplotlib - Mathematical Expressions
- Matplotlib - Animations
- Matplotlib - Celluloid Library
- Matplotlib - Blitting
- Matplotlib - Toolkits
- Matplotlib - Artists
- Matplotlib - Styling with Cycler
- Matplotlib - Paths
- Matplotlib - Path Effects
- Matplotlib - Transforms
- Matplotlib - Ticks and Tick Labels
- Matplotlib - Radian Ticks
- Matplotlib - Dateticks
- Matplotlib - Tick Formatters
- Matplotlib - Tick Locators
- Matplotlib - Basic Units
- Matplotlib - Autoscaling
- Matplotlib - Reverse Axes
- Matplotlib - Logarithmic Axes
- Matplotlib - Symlog
- Matplotlib - Unit Handling
- Matplotlib - Ellipse with Units
- Matplotlib - Spines
- Matplotlib - Axis Ranges
- Matplotlib - Axis Scales
- Matplotlib - Axis Ticks
- Matplotlib - Formatting Axes
- Matplotlib - Axes Class
- Matplotlib - Twin Axes
- Matplotlib - Figure Class
- Matplotlib - Multiplots
- Matplotlib - Grids
- Matplotlib - Object-oriented Interface
- Matplotlib - PyLab module
- Matplotlib - Subplots() Function
- Matplotlib - Subplot2grid() Function
- Matplotlib - Anchored Artists
- Matplotlib - Manual Contour
- Matplotlib - Coords Report
- Matplotlib - AGG filter
- Matplotlib - Ribbon Box
- Matplotlib - Fill Spiral
- Matplotlib - Findobj Method
- Matplotlib - Hyperlinks
- Matplotlib - Image Thumbnail
- Matplotlib - Plotting with Keywords
- Matplotlib - Create Logo
- Matplotlib - Multipage PDF
- Matplotlib - Multiprocessing
- Matplotlib - Print Stdout
- Matplotlib - Compound Path
- Matplotlib - Sankey Class
- Matplotlib - MRI with EEG
- Matplotlib - Stylesheets
- Matplotlib - Background Colors
- Matplotlib - Basemap
Matplotlib Events
- Matplotlib - Event Handling
- Matplotlib - Close Event
- Matplotlib - Mouse Move
- Matplotlib - Click Events
- Matplotlib - Scroll Event
- Matplotlib - Keypress Event
- Matplotlib - Pick Event
- Matplotlib - Looking Glass
- Matplotlib - Path Editor
- Matplotlib - Poly Editor
- Matplotlib - Timers
- Matplotlib - Viewlims
- Matplotlib - Zoom Window
Matplotlib Widgets
- Matplotlib - Cursor Widget
- Matplotlib - Annotated Cursor
- Matplotlib - Button Widget
- Matplotlib - Check Buttons
- Matplotlib - Lasso Selector
- Matplotlib - Menu Widget
- Matplotlib - Mouse Cursor
- Matplotlib - Multicursor
- Matplotlib - Polygon Selector
- Matplotlib - Radio Buttons
- Matplotlib - RangeSlider
- Matplotlib - Rectangle Selector
- Matplotlib - Ellipse Selector
- Matplotlib - Slider Widget
- Matplotlib - Span Selector
- Matplotlib - Textbox
Matplotlib Plotting
- Matplotlib - Line Plots
- Matplotlib - Area Plots
- Matplotlib - Bar Graphs
- Matplotlib - Histogram
- Matplotlib - Pie Chart
- Matplotlib - Scatter Plot
- Matplotlib - Box Plot
- Matplotlib - Arrow Demo
- Matplotlib - Fancy Boxes
- Matplotlib - Zorder Demo
- Matplotlib - Hatch Demo
- Matplotlib - Mmh Donuts
- Matplotlib - Ellipse Demo
- Matplotlib - Bezier Curve
- Matplotlib - Bubble Plots
- Matplotlib - Stacked Plots
- Matplotlib - Table Charts
- Matplotlib - Polar Charts
- Matplotlib - Hexagonal bin Plots
- Matplotlib - Violin Plot
- Matplotlib - Event Plot
- Matplotlib - Heatmap
- Matplotlib - Stairs Plots
- Matplotlib - Errorbar
- Matplotlib - Hinton Diagram
- Matplotlib - Contour Plot
- Matplotlib - Wireframe Plots
- Matplotlib - Surface Plots
- Matplotlib - Triangulations
- Matplotlib - Stream plot
- Matplotlib - Ishikawa Diagram
- Matplotlib - 3D Plotting
- Matplotlib - 3D Lines
- Matplotlib - 3D Scatter Plots
- Matplotlib - 3D Contour Plot
- Matplotlib - 3D Bar Plots
- Matplotlib - 3D Wireframe Plot
- Matplotlib - 3D Surface Plot
- Matplotlib - 3D Vignettes
- Matplotlib - 3D Volumes
- Matplotlib - 3D Voxels
- Matplotlib - Time Plots and Signals
- Matplotlib - Filled Plots
- Matplotlib - Step Plots
- Matplotlib - XKCD Style
- Matplotlib - Quiver Plot
- Matplotlib - Stem Plots
- Matplotlib - Visualizing Vectors
- Matplotlib - Audio Visualization
- Matplotlib - Audio Processing
Matplotlib Useful Resources
- Matplotlib - Quick Guide
- Matplotlib - Cheatsheet
- Matplotlib - Useful Resources
- Matplotlib - Discussion
Matplotlib - 3D Wireframes
A 3D wireframe plot is a way of representing data in three dimensions using lines to represent the shape of an object. A wireframe plot connects the data points of an object to create a mesh-like structure to show the shape of the object.
Imagine we have a cube and instead of drawing the solid faces of the cube, we only show the lines outlining its edges and corners. The outline we get is the 3D wireframe plot −
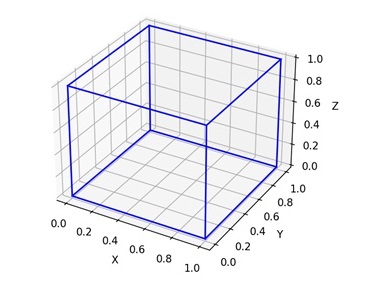
3D Wireframe Plot in Matplotlib
In Matplotlib, a 3D wireframe plot is a type of visualization where data is represented by a network of lines forming the edges of a three-dimensional surface.
We can create a 3D wireframe plot in Matplotlib using the plot_wireframe() function in the 'mpl_toolkits.mplot3d' module. This function accepts the X, Y, and Z coordinates of a 3D object and connects these coordinates with lines to create a 3D outline of the object.
Example - Basic 3D Wireframe Plot
Lets start by drawing a basic 3D wireframe plot.
A basic 3D wireframe plot in Matplotlib displays the surface of a 3D object as a mesh of lines, allowing you to visualize the shape and structure of the surface. The wireframe plot is formed by joining a series of points on the sphere's surface with straight lines running along the x, y, and z axes.
To create a wireframe plot, you can define arrays for the x, y, and z coordinates of the surface points you want to visualize. Then, you can pass these arrays to the plot_wireframe() function to generate the wireframe plot.
In the following example, we are creating a basic 3D wireframe plot of a spherical surface. First, we generate the X, Y, and Z points of the sphere by varying them with the angles 'theta' and 'phi'. Then, we use the plot_wireframe() function to create lines that connect the data points of the sphere. In the resultant plot, we get a 3D wireframe plot of a spherical surface −
import numpy as np
import matplotlib.pyplot as plt
from mpl_toolkits.mplot3d import Axes3D

# Generating data for a spherical surface
theta = np.linspace(0, 2*np.pi, 100)
phi = np.linspace(0, np.pi, 100)
theta, phi = np.meshgrid(theta, phi)
r = 1
x = r * np.sin(phi) * np.cos(theta)
y = r * np.sin(phi) * np.sin(theta)
z = r * np.cos(phi)

# Creating a 3D plot
fig = plt.figure()
ax = fig.add_subplot(111, projection='3d')

# Plotting the spherical wireframe
ax.plot_wireframe(x, y, z, color='blue')

# Adding labels and title
ax.set_xlabel('X')
ax.set_ylabel('Y')
ax.set_zlabel('Z')
ax.set_title('Basic 3D Wireframe Plot')

# Displaying the plot
plt.show()
Output
Following is the output of the above code −

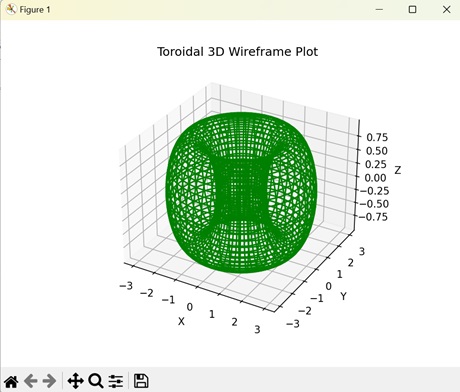
Example - Toroidal 3D Wireframe Plot
In Matplotlib, a toroidal 3D wireframe plot represents the surface of a torus using lines in three-dimensional space. A torus is a doughnut-shaped object with a hole in the middle. The wireframe plot connects the lines on surface of the torus to create its outline.
In here, we are generating a toroidal 3D wireframe plot. We start by creating the surface of the torus by varying the X and Y coordinates with angles 'theta' and 'phi' and with major radius 'R' and minor radius 'r', while the Z coordinate varies with 'r' and 'phi'. Then, we use the plot_wireframe() function to connect the coordinates with lines creating a resultant plot which represents a 3D wireframe plot of a torus −
import numpy as np
import matplotlib.pyplot as plt
from mpl_toolkits.mplot3d import Axes3D

# Generating data for a toroidal surface
theta = np.linspace(0, 2*np.pi, 100)
phi = np.linspace(0, 2*np.pi, 100)
theta, phi = np.meshgrid(theta, phi)
R = 2
r = 1
x = (R + r * np.cos(phi)) * np.cos(theta)
y = (R + r * np.cos(phi)) * np.sin(theta)
z = r * np.sin(phi)

# Creating a 3D plot
fig = plt.figure()
ax = fig.add_subplot(111, projection='3d')

# Plotting the toroidal wireframe
ax.plot_wireframe(x, y, z, color='green')

# Adding labels and title
ax.set_xlabel('X')
ax.set_ylabel('Y')
ax.set_zlabel('Z')
ax.set_title('Toroidal 3D Wireframe Plot')

# Displaying the plot
plt.show()
Output
On executing the above code we will get the following output −
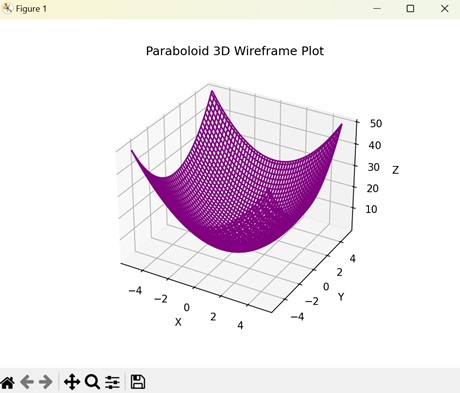
Example - Paraboloid 3D Wireframe Plot
A paraboloid 3D wireframe plot in Matplotlib displays the outline of a paraboloid using lines on a three-dimensional graph. A paraboloid is a three-dimensional parabola that resembles a bowl. The 3D wireframe plot connects the data points to create a mesh-like structure of the paraboloid.
The following example creates a 3D wireframe plot of a paraboloid in a 3D space. We create the paraboloid by evenly spacing the X, Y, and Z on a 3D graph. Then, we connect the coordinates with lines using the plot_wireframe() function to create a 3D wireframe plot −
import numpy as np
import matplotlib.pyplot as plt
from mpl_toolkits.mplot3d import Axes3D

# Generating data for a paraboloid surface
x = np.linspace(-5, 5, 100)
y = np.linspace(-5, 5, 100)
X, Y = np.meshgrid(x, y)
Z = X**2 + Y**2

# Creating a 3D plot
fig = plt.figure()
ax = fig.add_subplot(111, projection='3d')

# Plotting the paraboloid wireframe
ax.plot_wireframe(X, Y, Z, color='purple')

# Adding labels and title
ax.set_xlabel('X')
ax.set_ylabel('Y')
ax.set_zlabel('Z')
ax.set_title('Paraboloid 3D Wireframe Plot')

# Displaying the plot
plt.show()
Output
After executing the above code, we get the following output −
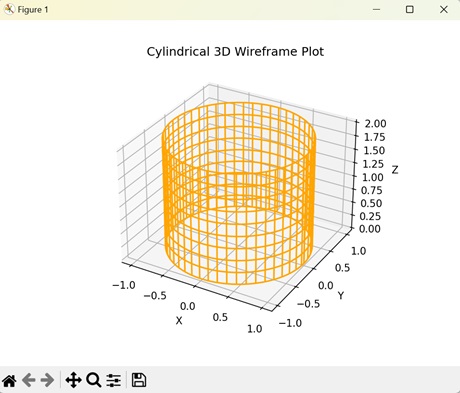
Example - Cylindrical 3D Wireframe Plot
In Matplotlib, a cylindrical wireframe plot is a visualization of the geometry of a cylinder in a three-dimensional space. A cylinder is a three-dimensional shape with a circular cross-section that extends along its length. The data points on the surface of the cylinder are connected with lines to create a 3D wireframe plot.
Now, we are generating a 3D wireframe plot for a cylinder on a 3D graph. We first plot the X and Y coordinates that represent the surface of the cylinder by varying them with the radius 'r' and the angle 'theta' (theta is in range 0 to 2 to cover a full circle). Then, we plot the Z coordinate that represents the height of the cylinder. After that, we use the plot_wireframe() function to join the coordinates with straight lines. This creates a resultant plot which shows the 3D wireframe plot of a cylinder −
import numpy as np
import matplotlib.pyplot as plt
from mpl_toolkits.mplot3d import Axes3D

# Defining the parameters
r = 1
h = 2
theta = np.linspace(0, 2*np.pi, 100)
z = np.linspace(0, h, 10)

# Generating cylinder coordinates
theta_3d, z_3d = np.meshgrid(theta, z)
x = r * np.cos(theta_3d)
y = r * np.sin(theta_3d)

# Creating a 3D plot
fig = plt.figure()
ax = fig.add_subplot(111, projection='3d')

# Plotting the cylindrical wireframe
ax.plot_wireframe(x, y, z_3d, color='orange')

# Adding labels and title
ax.set_xlabel('X')
ax.set_ylabel('Y')
ax.set_zlabel('Z')
ax.set_title('Cylindrical 3D Wireframe Plot')

# Displaying the plot
plt.show()
Output
On executing the above code we will get the following output −