- Matplotlib - Home
- Matplotlib - Introduction
- Matplotlib - Vs Seaborn
- Matplotlib - Environment Setup
- Matplotlib - Anaconda distribution
- Matplotlib - Jupyter Notebook
- Matplotlib - Pyplot API
- Matplotlib - Simple Plot
- Matplotlib - Saving Figures
- Matplotlib - Markers
- Matplotlib - Figures
- Matplotlib - Styles
- Matplotlib - Legends
- Matplotlib - Colors
- Matplotlib - Colormaps
- Matplotlib - Colormap Normalization
- Matplotlib - Choosing Colormaps
- Matplotlib - Colorbars
- Matplotlib - Working With Text
- Matplotlib - Text properties
- Matplotlib - Subplot Titles
- Matplotlib - Images
- Matplotlib - Image Masking
- Matplotlib - Annotations
- Matplotlib - Arrows
- Matplotlib - Fonts
- Matplotlib - Font Indexing
- Matplotlib - Font Properties
- Matplotlib - Scales
- Matplotlib - LaTeX
- Matplotlib - LaTeX Text Formatting in Annotations
- Matplotlib - PostScript
- Matplotlib - Mathematical Expressions
- Matplotlib - Animations
- Matplotlib - Celluloid Library
- Matplotlib - Blitting
- Matplotlib - Toolkits
- Matplotlib - Artists
- Matplotlib - Styling with Cycler
- Matplotlib - Paths
- Matplotlib - Path Effects
- Matplotlib - Transforms
- Matplotlib - Ticks and Tick Labels
- Matplotlib - Radian Ticks
- Matplotlib - Dateticks
- Matplotlib - Tick Formatters
- Matplotlib - Tick Locators
- Matplotlib - Basic Units
- Matplotlib - Autoscaling
- Matplotlib - Reverse Axes
- Matplotlib - Logarithmic Axes
- Matplotlib - Symlog
- Matplotlib - Unit Handling
- Matplotlib - Ellipse with Units
- Matplotlib - Spines
- Matplotlib - Axis Ranges
- Matplotlib - Axis Scales
- Matplotlib - Axis Ticks
- Matplotlib - Formatting Axes
- Matplotlib - Axes Class
- Matplotlib - Twin Axes
- Matplotlib - Figure Class
- Matplotlib - Multiplots
- Matplotlib - Grids
- Matplotlib - Object-oriented Interface
- Matplotlib - PyLab module
- Matplotlib - Subplots() Function
- Matplotlib - Subplot2grid() Function
- Matplotlib - Anchored Artists
- Matplotlib - Manual Contour
- Matplotlib - Coords Report
- Matplotlib - AGG filter
- Matplotlib - Ribbon Box
- Matplotlib - Fill Spiral
- Matplotlib - Findobj Method
- Matplotlib - Hyperlinks
- Matplotlib - Image Thumbnail
- Matplotlib - Plotting with Keywords
- Matplotlib - Create Logo
- Matplotlib - Multipage PDF
- Matplotlib - Multiprocessing
- Matplotlib - Print Stdout
- Matplotlib - Compound Path
- Matplotlib - Sankey Class
- Matplotlib - MRI with EEG
- Matplotlib - Stylesheets
- Matplotlib - Background Colors
- Matplotlib - Basemap
Matplotlib Events
- Matplotlib - Event Handling
- Matplotlib - Close Event
- Matplotlib - Mouse Move
- Matplotlib - Click Events
- Matplotlib - Scroll Event
- Matplotlib - Keypress Event
- Matplotlib - Pick Event
- Matplotlib - Looking Glass
- Matplotlib - Path Editor
- Matplotlib - Poly Editor
- Matplotlib - Timers
- Matplotlib - Viewlims
- Matplotlib - Zoom Window
Matplotlib Widgets
- Matplotlib - Cursor Widget
- Matplotlib - Annotated Cursor
- Matplotlib - Button Widget
- Matplotlib - Check Buttons
- Matplotlib - Lasso Selector
- Matplotlib - Menu Widget
- Matplotlib - Mouse Cursor
- Matplotlib - Multicursor
- Matplotlib - Polygon Selector
- Matplotlib - Radio Buttons
- Matplotlib - RangeSlider
- Matplotlib - Rectangle Selector
- Matplotlib - Ellipse Selector
- Matplotlib - Slider Widget
- Matplotlib - Span Selector
- Matplotlib - Textbox
Matplotlib Plotting
- Matplotlib - Line Plots
- Matplotlib - Area Plots
- Matplotlib - Bar Graphs
- Matplotlib - Histogram
- Matplotlib - Pie Chart
- Matplotlib - Scatter Plot
- Matplotlib - Box Plot
- Matplotlib - Arrow Demo
- Matplotlib - Fancy Boxes
- Matplotlib - Zorder Demo
- Matplotlib - Hatch Demo
- Matplotlib - Mmh Donuts
- Matplotlib - Ellipse Demo
- Matplotlib - Bezier Curve
- Matplotlib - Bubble Plots
- Matplotlib - Stacked Plots
- Matplotlib - Table Charts
- Matplotlib - Polar Charts
- Matplotlib - Hexagonal bin Plots
- Matplotlib - Violin Plot
- Matplotlib - Event Plot
- Matplotlib - Heatmap
- Matplotlib - Stairs Plots
- Matplotlib - Errorbar
- Matplotlib - Hinton Diagram
- Matplotlib - Contour Plot
- Matplotlib - Wireframe Plots
- Matplotlib - Surface Plots
- Matplotlib - Triangulations
- Matplotlib - Stream plot
- Matplotlib - Ishikawa Diagram
- Matplotlib - 3D Plotting
- Matplotlib - 3D Lines
- Matplotlib - 3D Scatter Plots
- Matplotlib - 3D Contour Plot
- Matplotlib - 3D Bar Plots
- Matplotlib - 3D Wireframe Plot
- Matplotlib - 3D Surface Plot
- Matplotlib - 3D Vignettes
- Matplotlib - 3D Volumes
- Matplotlib - 3D Voxels
- Matplotlib - Time Plots and Signals
- Matplotlib - Filled Plots
- Matplotlib - Step Plots
- Matplotlib - XKCD Style
- Matplotlib - Quiver Plot
- Matplotlib - Stem Plots
- Matplotlib - Visualizing Vectors
- Matplotlib - Audio Visualization
- Matplotlib - Audio Processing
Matplotlib Useful Resources
- Matplotlib - Quick Guide
- Matplotlib - Cheatsheet
- Matplotlib - Useful Resources
- Matplotlib - Discussion
Matplotlib - KeyPress Event
In computer programming, the detection and handling of keypress events are fundamental for capturing user input and enabling various functionalities within applications. Whether it's navigating through menus, entering text, triggering actions, or controlling interactive elements, keypress events play a crucial role in user interaction.
Matplotlib provides the tools for handling the keypress events, allowing you to capture and respond to keyboard inputs during interactive plotting sessions. When a key is pressed, Matplotlib triggers the key_press_event, allowing users to define custom actions based on the pressed keys.
The library attaches some keypress callbacks by default for enhanced interactivity. These default callbacks are documented in the Navigation keyboard shortcuts section of the Matplotlib documentation.
Example - Handling Keypress Event
Let's see this basic example, which demonstrates the default keypress events in Matplotlib.
import numpy as np
import matplotlib.pyplot as plt
# Define a function to handle keypress events
def press(event):
print('You pressed:', event.key)
# Create a Matplotlib figure and axis
fig, ax = plt.subplots()
# Connect the keypress event handler to the figure canvas
cid = fig.canvas.mpl_connect('key_press_event', press)
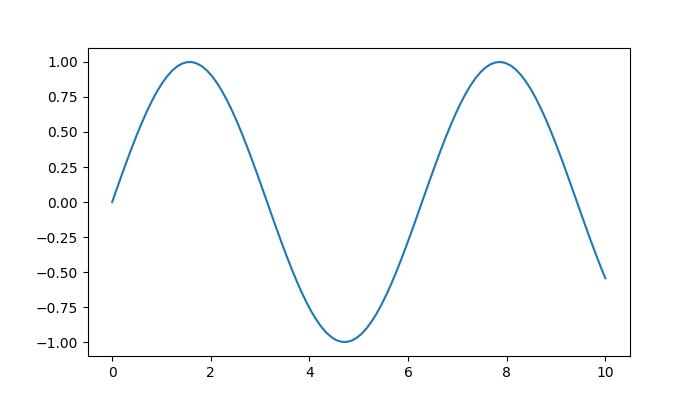
# Plot sin wave
x = np.linspace(0, 10, 100)
ax.plot(x, np.sin(x))
# Display the plot
plt.show()
Output
On executing the above program you will get the following figure, and press any key to observe the working of this example −
You pressed: tab
You pressed: caps_lock
You pressed: shift
You pressed: control
You pressed: alt
You pressed: meta
You pressed: a
You pressed: b
You pressed: c
You pressed: d
You pressed: s
You pressed: g
You pressed: g
You pressed: g
You pressed: g
You pressed: k
You pressed: k
You pressed: k
You pressed: k
You pressed: k
You pressed: k
You pressed: l
You pressed: l
You pressed: p
You pressed: p
You pressed: q
Watch the video below to observe how this keypress event feature works here.
From the above output, you can observe the working of some of the default keys like 'g' (toggling the grid), 's' (saving the figure), 'q' (closing the figure), and more.
Creating a Custom Keypress Event Function
To handle keypress events to specific needs, you can create a custom function and connect it to the key_press_event using the mpl_connect method.
Example - Custom KeyPress Event Handler
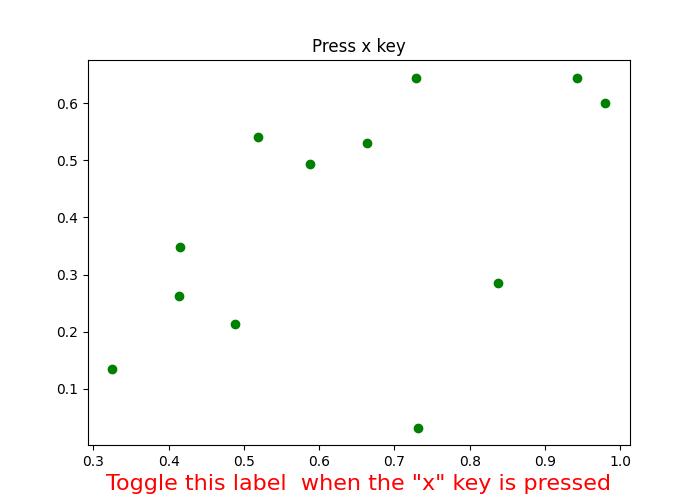
The following example demonstrates a simple keypress event function that toggles the visibility of an xlabel when the 'x' key is pressed.
import sys
import matplotlib.pyplot as plt
import numpy as np

def on_press(event):
   print('Pressed key:', event.key)
   sys.stdout.flush()

   # Toggle visibility of xlabel when 'x' key is pressed
   if event.key == 'x':
      visible = xl.get_visible()
      xl.set_visible(not visible)
      fig.canvas.draw()

fig, ax = plt.subplots()
fig.canvas.mpl_connect('key_press_event', on_press)

# Plot random data points
ax.plot(np.random.rand(12), np.random.rand(12), 'go')
xl = ax.set_xlabel('Toggle this label  when the "x" key is pressed',
   fontsize=16, color='red')
ax.set_title('Press x key')

plt.show()
Output
On executing the above program you will get the following figure, and press any key to observe the working of this example −
Pressed key: x
Pressed key: x
Pressed key: x
Pressed key: x
Pressed key: a
Pressed key: enter
Watch the video below to observe how this keypress event feature works here.
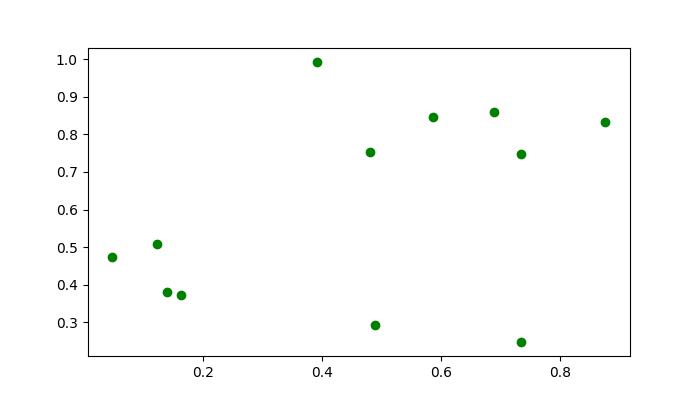
Example - Handling Escape Key to Exit Figure
Here is another example that demonstrates how to add the escape key to exit the figure in addition to the "q" key and also it calculates the how many number of times the enter key is pressed.
import numpy as np
import matplotlib.pyplot as plt

# Define a function to handle keypress events
def press(event):
   print('Pressed key:', event.key)

   # If the 'enter' key is pressed, append 1 to the count list
   if event.key == 'enter':
      cnt.append(1)

   # If the 'escape' key is pressed, close the plot
   if event.key == "escape":
      plt.close()

cnt = []

# Create a figure
fig, ax = plt.subplots()

# Connect the keypress event handler to the figure canvas
fig.canvas.mpl_connect('key_press_event', press)
ax.plot(np.random.rand(12), np.random.rand(12), 'go')
plt.show()

# Calculate and print the sum of counts
result = sum(cnt)
print(result, cnt)
Output
On executing the above program you will get the following figure, and press any key to observe the working of this example −
Pressed key: b
Pressed key: enter
Pressed key: enter
Pressed key: caps_lock
Pressed key: caps_lock
Pressed key: enter
Pressed key: escape
3 [1, 1, 1]