- Matplotlib - Home
- Matplotlib - Introduction
- Matplotlib - Vs Seaborn
- Matplotlib - Environment Setup
- Matplotlib - Anaconda distribution
- Matplotlib - Jupyter Notebook
- Matplotlib - Pyplot API
- Matplotlib - Simple Plot
- Matplotlib - Saving Figures
- Matplotlib - Markers
- Matplotlib - Figures
- Matplotlib - Styles
- Matplotlib - Legends
- Matplotlib - Colors
- Matplotlib - Colormaps
- Matplotlib - Colormap Normalization
- Matplotlib - Choosing Colormaps
- Matplotlib - Colorbars
- Matplotlib - Working With Text
- Matplotlib - Text properties
- Matplotlib - Subplot Titles
- Matplotlib - Images
- Matplotlib - Image Masking
- Matplotlib - Annotations
- Matplotlib - Arrows
- Matplotlib - Fonts
- Matplotlib - Font Indexing
- Matplotlib - Font Properties
- Matplotlib - Scales
- Matplotlib - LaTeX
- Matplotlib - LaTeX Text Formatting in Annotations
- Matplotlib - PostScript
- Matplotlib - Mathematical Expressions
- Matplotlib - Animations
- Matplotlib - Celluloid Library
- Matplotlib - Blitting
- Matplotlib - Toolkits
- Matplotlib - Artists
- Matplotlib - Styling with Cycler
- Matplotlib - Paths
- Matplotlib - Path Effects
- Matplotlib - Transforms
- Matplotlib - Ticks and Tick Labels
- Matplotlib - Radian Ticks
- Matplotlib - Dateticks
- Matplotlib - Tick Formatters
- Matplotlib - Tick Locators
- Matplotlib - Basic Units
- Matplotlib - Autoscaling
- Matplotlib - Reverse Axes
- Matplotlib - Logarithmic Axes
- Matplotlib - Symlog
- Matplotlib - Unit Handling
- Matplotlib - Ellipse with Units
- Matplotlib - Spines
- Matplotlib - Axis Ranges
- Matplotlib - Axis Scales
- Matplotlib - Axis Ticks
- Matplotlib - Formatting Axes
- Matplotlib - Axes Class
- Matplotlib - Twin Axes
- Matplotlib - Figure Class
- Matplotlib - Multiplots
- Matplotlib - Grids
- Matplotlib - Object-oriented Interface
- Matplotlib - PyLab module
- Matplotlib - Subplots() Function
- Matplotlib - Subplot2grid() Function
- Matplotlib - Anchored Artists
- Matplotlib - Manual Contour
- Matplotlib - Coords Report
- Matplotlib - AGG filter
- Matplotlib - Ribbon Box
- Matplotlib - Fill Spiral
- Matplotlib - Findobj Method
- Matplotlib - Hyperlinks
- Matplotlib - Image Thumbnail
- Matplotlib - Plotting with Keywords
- Matplotlib - Create Logo
- Matplotlib - Multipage PDF
- Matplotlib - Multiprocessing
- Matplotlib - Print Stdout
- Matplotlib - Compound Path
- Matplotlib - Sankey Class
- Matplotlib - MRI with EEG
- Matplotlib - Stylesheets
- Matplotlib - Background Colors
- Matplotlib - Basemap
Matplotlib Events
- Matplotlib - Event Handling
- Matplotlib - Close Event
- Matplotlib - Mouse Move
- Matplotlib - Click Events
- Matplotlib - Scroll Event
- Matplotlib - Keypress Event
- Matplotlib - Pick Event
- Matplotlib - Looking Glass
- Matplotlib - Path Editor
- Matplotlib - Poly Editor
- Matplotlib - Timers
- Matplotlib - Viewlims
- Matplotlib - Zoom Window
Matplotlib Widgets
- Matplotlib - Cursor Widget
- Matplotlib - Annotated Cursor
- Matplotlib - Button Widget
- Matplotlib - Check Buttons
- Matplotlib - Lasso Selector
- Matplotlib - Menu Widget
- Matplotlib - Mouse Cursor
- Matplotlib - Multicursor
- Matplotlib - Polygon Selector
- Matplotlib - Radio Buttons
- Matplotlib - RangeSlider
- Matplotlib - Rectangle Selector
- Matplotlib - Ellipse Selector
- Matplotlib - Slider Widget
- Matplotlib - Span Selector
- Matplotlib - Textbox
Matplotlib Plotting
- Matplotlib - Line Plots
- Matplotlib - Area Plots
- Matplotlib - Bar Graphs
- Matplotlib - Histogram
- Matplotlib - Pie Chart
- Matplotlib - Scatter Plot
- Matplotlib - Box Plot
- Matplotlib - Arrow Demo
- Matplotlib - Fancy Boxes
- Matplotlib - Zorder Demo
- Matplotlib - Hatch Demo
- Matplotlib - Mmh Donuts
- Matplotlib - Ellipse Demo
- Matplotlib - Bezier Curve
- Matplotlib - Bubble Plots
- Matplotlib - Stacked Plots
- Matplotlib - Table Charts
- Matplotlib - Polar Charts
- Matplotlib - Hexagonal bin Plots
- Matplotlib - Violin Plot
- Matplotlib - Event Plot
- Matplotlib - Heatmap
- Matplotlib - Stairs Plots
- Matplotlib - Errorbar
- Matplotlib - Hinton Diagram
- Matplotlib - Contour Plot
- Matplotlib - Wireframe Plots
- Matplotlib - Surface Plots
- Matplotlib - Triangulations
- Matplotlib - Stream plot
- Matplotlib - Ishikawa Diagram
- Matplotlib - 3D Plotting
- Matplotlib - 3D Lines
- Matplotlib - 3D Scatter Plots
- Matplotlib - 3D Contour Plot
- Matplotlib - 3D Bar Plots
- Matplotlib - 3D Wireframe Plot
- Matplotlib - 3D Surface Plot
- Matplotlib - 3D Vignettes
- Matplotlib - 3D Volumes
- Matplotlib - 3D Voxels
- Matplotlib - Time Plots and Signals
- Matplotlib - Filled Plots
- Matplotlib - Step Plots
- Matplotlib - XKCD Style
- Matplotlib - Quiver Plot
- Matplotlib - Stem Plots
- Matplotlib - Visualizing Vectors
- Matplotlib - Audio Visualization
- Matplotlib - Audio Processing
Matplotlib Useful Resources
- Matplotlib - Quick Guide
- Matplotlib - Cheatsheet
- Matplotlib - Useful Resources
- Matplotlib - Discussion
Matplotlib - Tick Locators
In general graphs and plottings, ticks play a crucial role in representing the scale of x and y-axes through small lines, offering a clear indication of the associated values. Tick locators, on the other hand, define the positions of these ticks along the axis, offering a visual representation of the scale.
The below image represents the major and minor ticks on a graph −
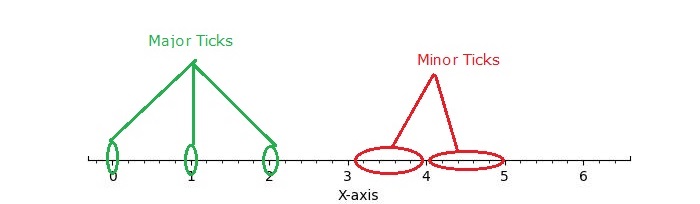
Tick Locators in Matplotlib
Matplotlib provides a mechanism for controlling the positioning of ticks on axes through its tick locators. The matplotlib.ticker module contains classes for configuring tick locating and formatting. These classes include generic tick locators, Formatters, and domain-specific custom ones. While locators are unaware of major or minor ticks, they are used by the Axis class to support major and minor tick locating and formatting.
Different Tick Locators
The matplotlib provides different tick locator within its ticker module, allowing users to customize the tick positions on axes. Some of the Tick Locators include −
- AutoLocator
- MaxNLocator
- LinearLocator
- LogLocator
- MultipleLocator
- FixedLocator
- IndexLocator
- NullLocator
- SymmetricalLogLocator
- AsinhLocator
- LogitLocator
- AutoMinorLocator
- Defining Custom Locators
Basic Setup
Before diving into specific tick locators, let's establish a common setup function to draw the plot with ticks.
import matplotlib.pyplot as plt
import numpy as np
import matplotlib.ticker as ticker

def draw_ticks(ax, title):
   # it shows the bottom spine only
   ax.yaxis.set_major_locator(ticker.NullLocator())
   ax.spines[['left', 'right', 'top']].set_visible(False)

   ax.xaxis.set_ticks_position('bottom')
   ax.tick_params(which='major', width=1.00, length=5)
   ax.tick_params(which='minor', width=0.75, length=2.5)
   ax.set_xlim(0, 5)
   ax.set_ylim(0, 1)
   ax.text(0.0, 0.2, title, transform=ax.transAxes,
      fontsize=14, fontname='Monospace', color='tab:blue')
Now, let's explore the working of each tick locator.
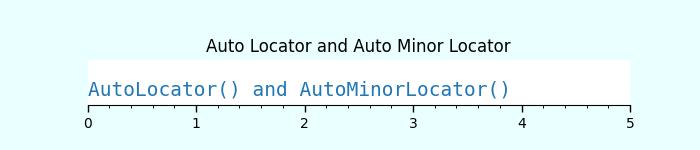
Auto Locator
The AutoLocator and AutoMinorLocator are used for automatically determining the positions of major and minor ticks on an axis, respectively.
Example - Using Auto Locators
This example demonstrates how to use the AutoLocator and AutoMinorLocator to automatically handle the positioning of major and minor ticks on an axis.
import matplotlib.pyplot as plt
import numpy as np
import matplotlib.ticker as ticker

def draw_ticks(ax, title):
   # it shows the bottom spine only
   ax.yaxis.set_major_locator(ticker.NullLocator())
   ax.spines[['left', 'right', 'top']].set_visible(False)

   ax.xaxis.set_ticks_position('bottom')
   ax.tick_params(which='major', width=1.00, length=5)
   ax.tick_params(which='minor', width=0.75, length=2.5)
   ax.set_xlim(0, 5)
   ax.set_ylim(0, 1)
   ax.text(0.0, 0.2, title, transform=ax.transAxes,
      fontsize=14, fontname='Monospace', color='tab:blue')

# Auto Locator
fig, ax = plt.subplots(1,1,figsize=(7,1.5), facecolor='#eaffff')
plt.subplots_adjust(bottom=0.3, top=0.6, wspace=0.2, hspace=0.4)
draw_ticks(ax, title="AutoLocator() and AutoMinorLocator()")
ax.xaxis.set_major_locator(ticker.AutoLocator())
ax.xaxis.set_minor_locator(ticker.AutoMinorLocator())
ax.set_title('Auto Locator and Auto Minor Locator')
plt.show()
Output
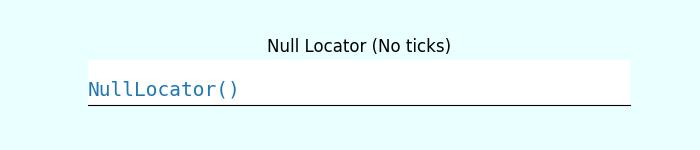
Null Locator
The NullLocator places no ticks on the axis.
Example - Using Null Locator
Lets see the following example for working of the NullLocator.
import matplotlib.pyplot as plt
import numpy as np
import matplotlib.ticker as ticker

def draw_ticks(ax, title):
   # it shows the bottom spine only
   ax.yaxis.set_major_locator(ticker.NullLocator())
   ax.spines[['left', 'right', 'top']].set_visible(False)

   ax.xaxis.set_ticks_position('bottom')
   ax.tick_params(which='major', width=1.00, length=5)
   ax.tick_params(which='minor', width=0.75, length=2.5)
   ax.set_xlim(0, 5)
   ax.set_ylim(0, 1)
   ax.text(0.0, 0.2, title, transform=ax.transAxes,
      fontsize=14, fontname='Monospace', color='tab:blue')

# Null Locator
fig, ax = plt.subplots(1,1,figsize=(7,1.5), facecolor='#eaffff')
plt.subplots_adjust(bottom=0.3, top=0.6, wspace=0.2, hspace=0.4)
draw_ticks(ax, title="NullLocator()")
ax.xaxis.set_major_locator(ticker.NullLocator())
ax.xaxis.set_minor_locator(ticker.NullLocator())
ax.set_title('Null Locator (No ticks)')
plt.show()
Output
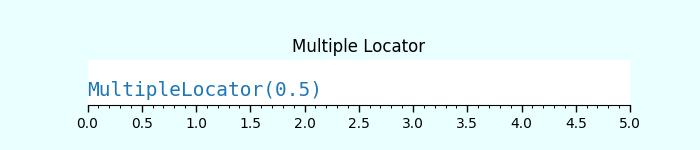
Multiple Locator
The MultipleLocator() class allows ticks to be positioned at multiples of a specified base, supporting both integer and float values.
Example - Using Multiple Locators
The following example demonstrates how to use the MultipleLocator() class.
import matplotlib.pyplot as plt
import numpy as np
import matplotlib.ticker as ticker

def draw_ticks(ax, title):
   # it shows the bottom spine only
   ax.yaxis.set_major_locator(ticker.NullLocator())
   ax.spines[['left', 'right', 'top']].set_visible(False)

   ax.xaxis.set_ticks_position('bottom')
   ax.tick_params(which='major', width=1.00, length=5)
   ax.tick_params(which='minor', width=0.75, length=2.5)
   ax.set_xlim(0, 5)
   ax.set_ylim(0, 1)
   ax.text(0.0, 0.2, title, transform=ax.transAxes,
      fontsize=14, fontname='Monospace', color='tab:blue')

# Multiple Locator
fig, ax = plt.subplots(1,1,figsize=(7,1.5), facecolor='#eaffff')
plt.subplots_adjust(bottom=0.3, top=0.6, wspace=0.2, hspace=0.4)
draw_ticks(ax, title="MultipleLocator(0.5)")
ax.xaxis.set_major_locator(ticker.MultipleLocator(0.5))
ax.xaxis.set_minor_locator(ticker.MultipleLocator(0.1))
ax.set_title('Multiple Locator')
plt.show()
Output
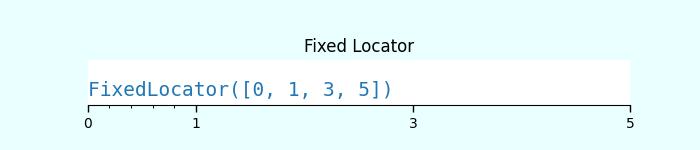
Fixed Locator
The FixedLocator() places ticks at specified fixed locations.
Example - Using Fixed Locator
Here is an example of using the FixedLocator() class.
import matplotlib.pyplot as plt
import numpy as np
import matplotlib.ticker as ticker

def draw_ticks(ax, title):
   # it shows the bottom spine only
   ax.yaxis.set_major_locator(ticker.NullLocator())
   ax.spines[['left', 'right', 'top']].set_visible(False)

   ax.xaxis.set_ticks_position('bottom')
   ax.tick_params(which='major', width=1.00, length=5)
   ax.tick_params(which='minor', width=0.75, length=2.5)
   ax.set_xlim(0, 5)
   ax.set_ylim(0, 1)
   ax.text(0.0, 0.2, title, transform=ax.transAxes,
      fontsize=14, fontname='Monospace', color='tab:blue')

# Fixed Locator
fig, ax = plt.subplots(1,1,figsize=(7,1.5), facecolor='#eaffff')
plt.subplots_adjust(bottom=0.3, top=0.6, wspace=0.2, hspace=0.4)
draw_ticks(ax, title="FixedLocator([0, 1, 3, 5])")
ax.xaxis.set_major_locator(ticker.FixedLocator([0, 1, 3, 5]))
ax.xaxis.set_minor_locator(ticker.FixedLocator(np.linspace(0.2, 0.8, 4)))
ax.set_title('Fixed Locator')
plt.show()
Output
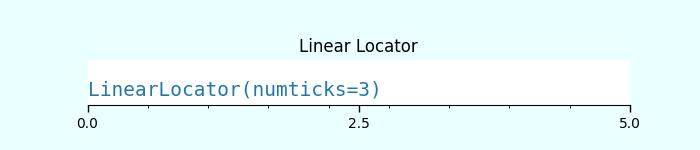
Linear Locator
The LinearLocator spaces ticks evenly between specified minimum and maximum values.
Example - Using Linear Locator
Here is an example that applies the Linear Locator to the major and minor ticks of an axes.
import matplotlib.pyplot as plt
import numpy as np
import matplotlib.ticker as ticker

def draw_ticks(ax, title):
   # it shows the bottom spine only
   ax.yaxis.set_major_locator(ticker.NullLocator())
   ax.spines[['left', 'right', 'top']].set_visible(False)

   ax.xaxis.set_ticks_position('bottom')
   ax.tick_params(which='major', width=1.00, length=5)
   ax.tick_params(which='minor', width=0.75, length=2.5)
   ax.set_xlim(0, 5)
   ax.set_ylim(0, 1)
   ax.text(0.0, 0.2, title, transform=ax.transAxes,
      fontsize=14, fontname='Monospace', color='tab:blue')

# Linear Locator
fig, ax = plt.subplots(1,1,figsize=(7,1.5), facecolor='#eaffff')
plt.subplots_adjust(bottom=0.3, top=0.6, wspace=0.2, hspace=0.4)
draw_ticks(ax, title="LinearLocator(numticks=3)")
ax.xaxis.set_major_locator(ticker.LinearLocator(3))
ax.xaxis.set_minor_locator(ticker.LinearLocator(10))
ax.set_title('Linear Locator')
plt.show()
Output
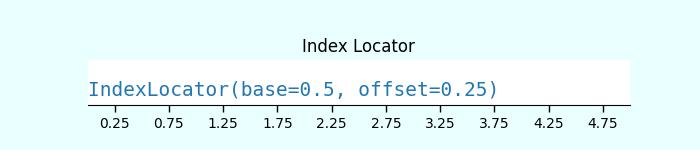
Index Locator
This locator is suitable for index plots, where x = range(len(y)).
Example - Using Index Locator
Here is an example that uses the index loctator (ticker.IndexLocator() class).
import matplotlib.pyplot as plt
import numpy as np
import matplotlib.ticker as ticker

def draw_ticks(ax, title):
   # it shows the bottom spine only
   ax.yaxis.set_major_locator(ticker.NullLocator())
   ax.spines[['left', 'right', 'top']].set_visible(False)

   ax.xaxis.set_ticks_position('bottom')
   ax.tick_params(which='major', width=1.00, length=5)
   ax.tick_params(which='minor', width=0.75, length=2.5)
   ax.set_xlim(0, 5)
   ax.set_ylim(0, 1)
   ax.text(0.0, 0.2, title, transform=ax.transAxes,
      fontsize=14, fontname='Monospace', color='tab:blue')

# Index Locator
fig, ax = plt.subplots(1,1,figsize=(7,1.5), facecolor='#eaffff')
plt.subplots_adjust(bottom=0.3, top=0.6, wspace=0.2, hspace=0.4)
draw_ticks(ax, title="IndexLocator(base=0.5, offset=0.25)")
ax.plot([0]*5, color='white')
ax.xaxis.set_major_locator(ticker.IndexLocator(base=0.5, offset=0.25))
ax.set_title('Index Locator')
plt.show()
Output
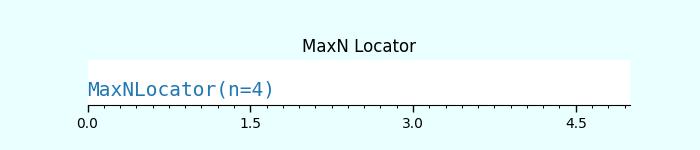
MaxN Locator
The MaxNLocator finds up to a maximum number of intervals with ticks at nice locations.Example - Using MaxN Locator
Here is an example of using the MaxNLocator() class for both major and minor ticks.
import matplotlib.pyplot as plt
import numpy as np
import matplotlib.ticker as ticker

def draw_ticks(ax, title):
   # it shows the bottom spine only
   ax.yaxis.set_major_locator(ticker.NullLocator())
   ax.spines[['left', 'right', 'top']].set_visible(False)

   ax.xaxis.set_ticks_position('bottom')
   ax.tick_params(which='major', width=1.00, length=5)
   ax.tick_params(which='minor', width=0.75, length=2.5)
   ax.set_xlim(0, 5)
   ax.set_ylim(0, 1)
   ax.text(0.0, 0.2, title, transform=ax.transAxes,
      fontsize=14, fontname='Monospace', color='tab:blue')

# MaxN Locator
fig, ax = plt.subplots(1,1,figsize=(7,1.5), facecolor='#eaffff')
plt.subplots_adjust(bottom=0.3, top=0.6, wspace=0.2, hspace=0.4)
draw_ticks(ax, title="MaxNLocator(n=4)")
ax.xaxis.set_major_locator(ticker.MaxNLocator(4))
ax.xaxis.set_minor_locator(ticker.MaxNLocator(40))
ax.set_title('MaxN Locator')
plt.show()
Output
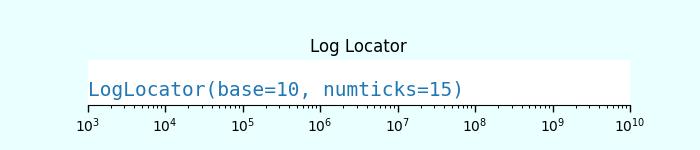
Log Locator
The LogLocator is used for spacing ticks logarithmically from min to max.
Example - Using Log Locator
Let's see an example of using the Log Locator. It shows the minor tick labels on a log-scale.
import matplotlib.pyplot as plt
import numpy as np
import matplotlib.ticker as ticker

def draw_ticks(ax, title):
   # it shows the bottom spine only
   ax.yaxis.set_major_locator(ticker.NullLocator())
   ax.spines[['left', 'right', 'top']].set_visible(False)

   ax.xaxis.set_ticks_position('bottom')
   ax.tick_params(which='major', width=1.00, length=5)
   ax.tick_params(which='minor', width=0.75, length=2.5)
   ax.set_xlim(0, 5)
   ax.set_ylim(0, 1)
   ax.text(0.0, 0.2, title, transform=ax.transAxes,
      fontsize=14, fontname='Monospace', color='tab:blue')

# Log Locator
fig, ax = plt.subplots(1,1,figsize=(7,1.5), facecolor='#eaffff')
plt.subplots_adjust(bottom=0.3, top=0.6, wspace=0.2, hspace=0.4)
draw_ticks(ax, title="LogLocator(base=10, numticks=15)")
ax.set_xlim(10**3, 10**10)
ax.set_xscale('log')
ax.xaxis.set_major_locator(ticker.LogLocator(base=10, numticks=15))
ax.set_title('Log Locator')
plt.show()
Output