- Matplotlib - Home
- Matplotlib - Introduction
- Matplotlib - Vs Seaborn
- Matplotlib - Environment Setup
- Matplotlib - Anaconda distribution
- Matplotlib - Jupyter Notebook
- Matplotlib - Pyplot API
- Matplotlib - Simple Plot
- Matplotlib - Saving Figures
- Matplotlib - Markers
- Matplotlib - Figures
- Matplotlib - Styles
- Matplotlib - Legends
- Matplotlib - Colors
- Matplotlib - Colormaps
- Matplotlib - Colormap Normalization
- Matplotlib - Choosing Colormaps
- Matplotlib - Colorbars
- Matplotlib - Working With Text
- Matplotlib - Text properties
- Matplotlib - Subplot Titles
- Matplotlib - Images
- Matplotlib - Image Masking
- Matplotlib - Annotations
- Matplotlib - Arrows
- Matplotlib - Fonts
- Matplotlib - Font Indexing
- Matplotlib - Font Properties
- Matplotlib - Scales
- Matplotlib - LaTeX
- Matplotlib - LaTeX Text Formatting in Annotations
- Matplotlib - PostScript
- Matplotlib - Mathematical Expressions
- Matplotlib - Animations
- Matplotlib - Celluloid Library
- Matplotlib - Blitting
- Matplotlib - Toolkits
- Matplotlib - Artists
- Matplotlib - Styling with Cycler
- Matplotlib - Paths
- Matplotlib - Path Effects
- Matplotlib - Transforms
- Matplotlib - Ticks and Tick Labels
- Matplotlib - Radian Ticks
- Matplotlib - Dateticks
- Matplotlib - Tick Formatters
- Matplotlib - Tick Locators
- Matplotlib - Basic Units
- Matplotlib - Autoscaling
- Matplotlib - Reverse Axes
- Matplotlib - Logarithmic Axes
- Matplotlib - Symlog
- Matplotlib - Unit Handling
- Matplotlib - Ellipse with Units
- Matplotlib - Spines
- Matplotlib - Axis Ranges
- Matplotlib - Axis Scales
- Matplotlib - Axis Ticks
- Matplotlib - Formatting Axes
- Matplotlib - Axes Class
- Matplotlib - Twin Axes
- Matplotlib - Figure Class
- Matplotlib - Multiplots
- Matplotlib - Grids
- Matplotlib - Object-oriented Interface
- Matplotlib - PyLab module
- Matplotlib - Subplots() Function
- Matplotlib - Subplot2grid() Function
- Matplotlib - Anchored Artists
- Matplotlib - Manual Contour
- Matplotlib - Coords Report
- Matplotlib - AGG filter
- Matplotlib - Ribbon Box
- Matplotlib - Fill Spiral
- Matplotlib - Findobj Method
- Matplotlib - Hyperlinks
- Matplotlib - Image Thumbnail
- Matplotlib - Plotting with Keywords
- Matplotlib - Create Logo
- Matplotlib - Multipage PDF
- Matplotlib - Multiprocessing
- Matplotlib - Print Stdout
- Matplotlib - Compound Path
- Matplotlib - Sankey Class
- Matplotlib - MRI with EEG
- Matplotlib - Stylesheets
- Matplotlib - Background Colors
- Matplotlib - Basemap
Matplotlib Events
- Matplotlib - Event Handling
- Matplotlib - Close Event
- Matplotlib - Mouse Move
- Matplotlib - Click Events
- Matplotlib - Scroll Event
- Matplotlib - Keypress Event
- Matplotlib - Pick Event
- Matplotlib - Looking Glass
- Matplotlib - Path Editor
- Matplotlib - Poly Editor
- Matplotlib - Timers
- Matplotlib - Viewlims
- Matplotlib - Zoom Window
Matplotlib Widgets
- Matplotlib - Cursor Widget
- Matplotlib - Annotated Cursor
- Matplotlib - Button Widget
- Matplotlib - Check Buttons
- Matplotlib - Lasso Selector
- Matplotlib - Menu Widget
- Matplotlib - Mouse Cursor
- Matplotlib - Multicursor
- Matplotlib - Polygon Selector
- Matplotlib - Radio Buttons
- Matplotlib - RangeSlider
- Matplotlib - Rectangle Selector
- Matplotlib - Ellipse Selector
- Matplotlib - Slider Widget
- Matplotlib - Span Selector
- Matplotlib - Textbox
Matplotlib Plotting
- Matplotlib - Line Plots
- Matplotlib - Area Plots
- Matplotlib - Bar Graphs
- Matplotlib - Histogram
- Matplotlib - Pie Chart
- Matplotlib - Scatter Plot
- Matplotlib - Box Plot
- Matplotlib - Arrow Demo
- Matplotlib - Fancy Boxes
- Matplotlib - Zorder Demo
- Matplotlib - Hatch Demo
- Matplotlib - Mmh Donuts
- Matplotlib - Ellipse Demo
- Matplotlib - Bezier Curve
- Matplotlib - Bubble Plots
- Matplotlib - Stacked Plots
- Matplotlib - Table Charts
- Matplotlib - Polar Charts
- Matplotlib - Hexagonal bin Plots
- Matplotlib - Violin Plot
- Matplotlib - Event Plot
- Matplotlib - Heatmap
- Matplotlib - Stairs Plots
- Matplotlib - Errorbar
- Matplotlib - Hinton Diagram
- Matplotlib - Contour Plot
- Matplotlib - Wireframe Plots
- Matplotlib - Surface Plots
- Matplotlib - Triangulations
- Matplotlib - Stream plot
- Matplotlib - Ishikawa Diagram
- Matplotlib - 3D Plotting
- Matplotlib - 3D Lines
- Matplotlib - 3D Scatter Plots
- Matplotlib - 3D Contour Plot
- Matplotlib - 3D Bar Plots
- Matplotlib - 3D Wireframe Plot
- Matplotlib - 3D Surface Plot
- Matplotlib - 3D Vignettes
- Matplotlib - 3D Volumes
- Matplotlib - 3D Voxels
- Matplotlib - Time Plots and Signals
- Matplotlib - Filled Plots
- Matplotlib - Step Plots
- Matplotlib - XKCD Style
- Matplotlib - Quiver Plot
- Matplotlib - Stem Plots
- Matplotlib - Visualizing Vectors
- Matplotlib - Audio Visualization
- Matplotlib - Audio Processing
Matplotlib Useful Resources
- Matplotlib - Quick Guide
- Matplotlib - Cheatsheet
- Matplotlib - Useful Resources
- Matplotlib - Discussion
Matplotlib - Object-oriented Interface
The Object-Oriented Interface in Matplotlib is an approach to creating plots that involves explicitly creating and manipulating objects representing different elements of the plot. In this context, interfaces refer to the different programming approaches or styles provided by the library for creating visualizations.
Interfaces in Matplotlib
The Matplotlib offers two primary approaches for creating plots −
- The functional interface (also known as An implicit or pyplot interface) and
- The object-oriented interface (called An explicit or Axes interface).
Functional Interface (Pyplot)
The functional interface, also known as the pyplot interface, is an implicit and state-based approach. It keeps track of the last Figure and Axes created and it implicitly adds artists to the object, because it assumes the user wants that artist. This interface is convenient for quick plot generation and modification but may lack scalability for intricate plots.
Example - Creating a Plot
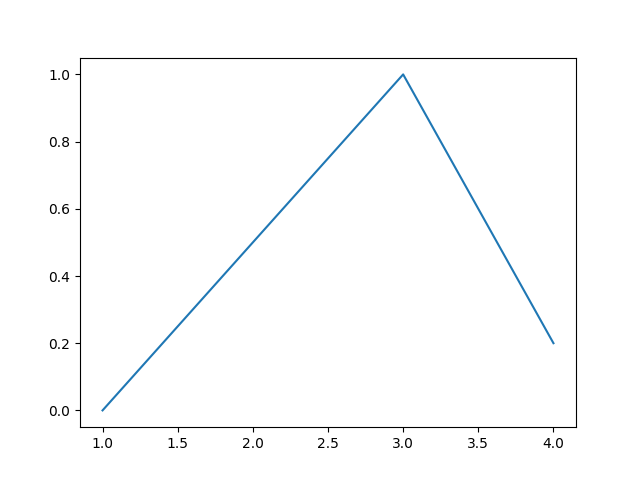
Here is a simple example that creates a plot using the implicit "pyplot" interface.
import matplotlib.pyplot as plt

plt.plot([1, 2, 3, 4], [0, 0.5, 1, 0.2])
plt.show()
Output
On executing the above code you will get the following output −
Object-Oriented Interface
The object-oriented interface, on the other hand, offers explicit control over the creation of Figure and Axes objects. It involves creating instances of these objects and calling methods on them to build a visualization step by step. This approach is more structured and recommended for complex and multi-plot scenarios.
The main idea behind using the more formal object-oriented method is to create figure objects and then just call methods or attributes off of that object. This approach helps better in dealing with a canvas that has multiple plots on it.
In object-oriented interface, Pyplot is used only for a few functions such as figure creation, and the user explicitly creates and keeps track of the figure and axes objects. At this level, the user uses Pyplot to create figures, and through those figures, one or more axes objects can be created. These axes objects are then used for most plotting actions.
Example - Object Oriented Interface
This example creates a simple plot using the object-oriented interface.
import matplotlib.pyplot as plt

# Create a Figure instance
fig = plt.figure()

# Create an Axes object using subplots method
ax = fig.subplots()

# Plot the data
ax.plot([1, 2, 3, 4], [0, 0.5, 1, 0.2])

# Display the plot
plt.show()
Output
On executing the above code you will get the following output −

Difference Between Both the Interfaces
From the above two examples, you can observe the difference between above two approaches. The functional approach uses the plt.plot() function, which is belongs to the matplotlib.pyplot family.
Whereas the ax.plot() function is a method available to all Figure objects, specifically an Axes method. This follows an object-oriented approach, where a Figure object is created, and Axes objects are explicitly referenced and used to build the plot step-by-step.
Working with Object-Oriented Interface
In this approach, a plot is structured as a Figure object, which acts as a canvas, and artists are the elements contributing to the final graphic image. The Axes class represents an individual plot, and a Figure can contain multiple Axes objects.
Example - Creating Figure and Axes Objects
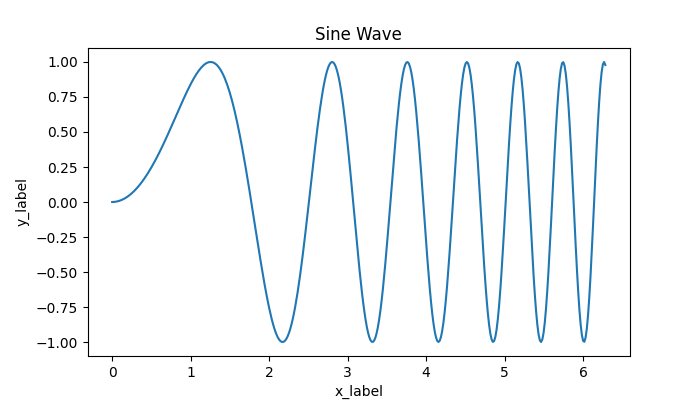
In this example, we explicitly create a Figure and an Axes object, providing a foundation for customizing and building complex visualizations.
import matplotlib.pyplot as plt
import numpy as np

# Sample data
x = np.linspace(0, 2 * np.pi, 400)
y = np.sin(x ** 2)

# Create a Figure instance
fig, ax = plt.subplots(figsize=(7,4))

# Plot data
ax.plot(x, y)

# Customize the plot
ax.set_title("Sine Wave")
ax.set_xlabel('x_label')
ax.set_ylabel('y_label')

# Display the plot
plt.show()
Output
On executing the above code you will get the following output −
Creating Subplots in OO Interface
To create subplots in the Object-Oriented Interface, we explicitly create both Figure and Axes objects, allowing for more control over layout and customization.
Example - Creating Subplots using OO Interface
The following example creates the subplot using the Object-Oriented Interface.
import matplotlib.pyplot as plt
import numpy as np

# Sample Data
x = np.linspace(0, 2 * np.pi, 400)
y1 = np.sin(x**2)
y2 = np.cos(x**2)

# Create subplots
fig, axs = plt.subplots(2, figsize=(7,4))
fig.suptitle('Creating Subplots in explicit interface')

# Plotting data on individual subplots
axs[0].plot(x, y1)
axs[1].plot(x, y2)

# Adding titles to subplots
axs[0].set_title('Sin Plot')
axs[1].set_title('Cos Plot')

# Adjust the layout
plt.tight_layout()

# Displaying the plot
plt.show()
Output
On executing the above code you will get the following output −

