
Article Categories
- All Categories
-
 Data Structure
-
 Networking
-
 RDBMS
RDBMS
-
 Operating System
-
 Java
Java
-
 MS Excel
-
 iOS
iOS
-
 HTML
HTML
-
 CSS
CSS
-
 Android
-
 Python
-
 C Programming
-
 C++
C++
-
 C#
C#
-
 MongoDB
-
 MySQL
MySQL
-
 Javascript
-
 PHP
PHP
-
 Economics & Finance
Selected Reading
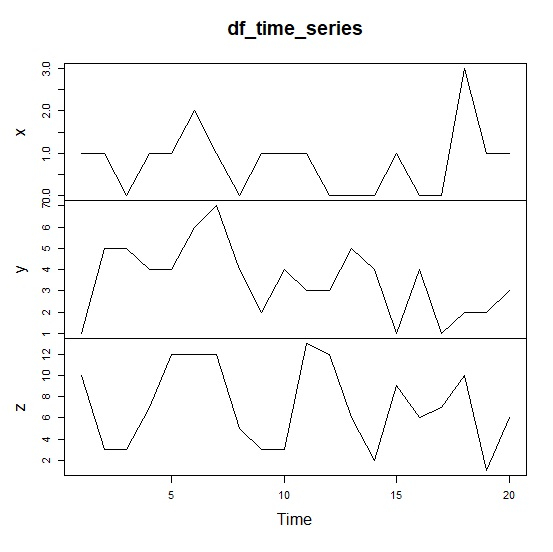
How to plot time series data with labels in R?
If we have time series data stored in a data frame then plotting the same as a time series cannot be done directly, also the labels for the series might not be possible directly. Therefore, we first need to convert the data frame to a time series object by using the function ts as shown in the below example and then using the plot function to create the plot, this will display the labels for the series as well.
Consider the below data frame −
Example
Time<-1:20
x<-rpois(20,1)
y<-rpois(20,3)
z<-rpois(20,8)
df<-data.frame(Time,x,y,z)
df
Output
  Time x   y  z
1  1   1   1  10
2  2   1   5  3
3  3   0   5  3
4  4   1   4  7
5  5   1   4  12
6  6   2   6  12
7  7   1   7  12
8  8   0   4  5
9  9   1   2  3
10 10  1   4  3
11 11  1   3  13
12 12  0   3  12
13 13  0   5  6
14 14  0   4  2
15 15  1   1  9
16 16  0   4  6
17 17  0   1  7
18 18  3   2  10
19 19  1   2   1
20 20  1   3   6
Converting df to time series object −
Example
df_time_series<-ts(df[-1])
df_time_series
Time Series:
Start = 1
End = 20
Frequency = 1
Output
   x  y  z
1  1  1  10
2  1  5  3
3  0  5  3
4  1  4  7
5  1  4  12
6  2  6  12
7  1  7  12
8  0  4  5
9  1  2  3
10 1  4  3
11 1  3  13
12 0  3  12
13 0  5  6
14 0  4  2
15 1  1  9
16 0  4  6
17 0  1  7
18 3  2  10
19 1  2  1
20 1  3  6
Plotting time series data with labels −
Example
plot(df_time_series)
Output

Updated on: 2026-03-11T22:50:55+05:30
638 Views

Advertisements