 Data Structure
 Networking
 RDBMS
RDBMS Operating System
 Java
Java MS Excel
 iOS
iOS HTML
HTML CSS
CSS Android
 Python
 C Programming
 C++
C++ C#
C# MongoDB
 MySQL
MySQL Javascript
 PHP
PHP
- Selected Reading
- UPSC IAS Exams Notes
- Developer's Best Practices
- Questions and Answers
- Effective Resume Writing
- HR Interview Questions
- Computer Glossary
- Who is Who
How to Make a Time Series Plot with Rolling Average in Python?
In this article, we will look at two methods for making a Python time series plot with a rolling average. Both strategies make use of well-known libraries like Matplotlib, Pandas, and Seaborn, which offer strong capabilities for data manipulation and visualization. Following these methods will enable you to visualize time series data with a rolling average efficiently and get an understanding of its general behavior.
Both methods utilize a similar set of sequential steps, that involve loading the data, turning the date column to a DateTime object, figuring out the rolling average, and producing the plot. The primary distinction is seen in the libraries and functions utilized to produce the plot. You are free to select the strategy that best suits your knowledge and tastes.
Approaches
Utilizing the Pandas and Matplotlib.
Utilizing the Seaborn and Pandas.
Note: The data utilized here is given below ?
File name can be changed as per the need. Here the file name is dataS.csv.
date,value
2022-01-01,10
2022-01-02,15
2022-01-03,12
2022-01-04,18
2022-01-05,20
2022-01-06,17
2022-01-07,14
2022-01-08,16
2022-01-09,19
Let's examine both strategies ?
Approach 1: Utilizing the Pandas and Matplotlib
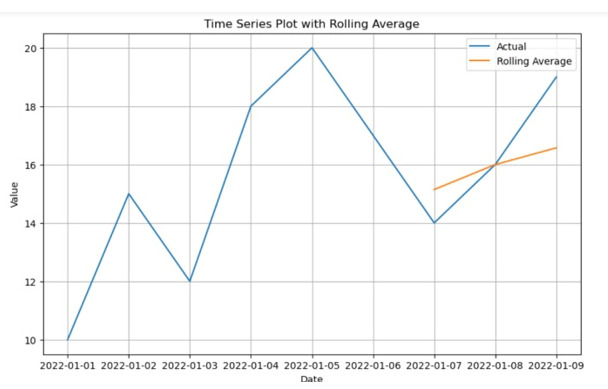
The approach utilizes Pandas as well as the matplotlib library to plot a Time series plot. An extensive choice of tools is available in the popular charting library Matplotlib for the development of static, animated, and interactive visualizations. The strong data manipulation library Pandas, on the other hand, offers useful data structures and functions for working with structured data, including time series.
Algorithm
Step 1 ? The matplotlib.pyplot for data visualization, as well as pandas for data manipulation, are imported.
Step 2 ? Load the time series data from the CSV file using pd.read_csv(). Assuming the file is named 'dataS.csv'.
Step 3 ? The 'date' column is converted of the DataFrame to a DateTime object utilizing pd.to_datetime().
Step 4 ? Place the column date as the index of the DataFrame utilizing data.set_index('date', inplace=True).
Step 5 ? Describe the window size for the rolling average calculation. Adjust the window_size variable as per the expected window size.
Step 6 ? Compute the rolling average of the 'value' column utilizing the data['value'].rolling(window=window_size).mean().
Step 7 ? Build the plot utilizing the plt.figure(). Adjust the figure size as necessary with figsize=(10, 6)
Step 8 ? Plot the actual values utilizing plt.plot(data.index, data['value'], label='Actual').
Step 9 ? Plot the rolling average values utilizing plt.plot(data.index, rolling_avg, label='Rolling Average').
Step 10 ? Enable the labels for the x-axis as well as the y-axis utilizing plt.xlabel() as well as plt.ylabel().
Step 11 ? Enable the title of the plot utilizing the plt.title().
Step 12 ? Show a legend for the plotted lines utilizing plt.legend().
Step 13 ? Enable the grid on the plot using plt.grid(True).
Step 14 ? Display the plot utilizing the plt.show().
Program
#pandas library is imported
import pandas as pd
import matplotlib.pyplot as plt

# Load the time series data
data = pd.read_csv('dataS.csv')

# Transform the column date to a datetime object
data['date'] = pd.to_datetime(data['date'])

# Put the column date column as the index
data.set_index('date', inplace=True)

# Calculate the rolling average
window_size = 7  # Adjust the window size as per your requirement
rolling_avg = data['value'].rolling(window=window_size).mean()

#  Create the plot
plt.figure(figsize=(10, 6))  # Adjust the figure size as needed
plt.plot(data.index, data['value'], label='Actual')
plt.plot(data.index, rolling_avg, label='Rolling Average')
plt.xlabel('Date')
plt.ylabel('Value')
plt.title('Time Series Plot with Rolling Average')
plt.legend()
plt.grid(True)
plt.show()
Output

Approach 2: Utilizing the Seaborn and Pandas
This introduces the usage of Seaborn, a high-level Matplotlib-based data visualization framework. Seaborn is a great option for developing visually appealing time series plots since it offers a straightforward and appealing interface for statistical graphics.
Step 1 ? The seaborn, pandas as well as matplotlib.pyplot libraries are imported
Step 2 ? Hold the time series data from the 'dataS.csv' file utilizing the pd.read_csv() function and also hold it in the data variable.
Step 3 ? The 'date' column in the data DataFrame is converted to a datetime object utilizing the pd.to_datetime() function.
Step 4 ? Put the column date as the index of the DataFrame utilizing the set_index() method.
Step 5 ? Window size is described for the rolling average computation. Adjust the window_size variable as per the need.
Step 6 ? Compute the rolling average utilizing the rolling() function on the 'value' column of the data DataFrame and indicating the window size.
Step 7 ? Build a new figure with a specific size utilizing plt.figure(figsize=(10, 6)).
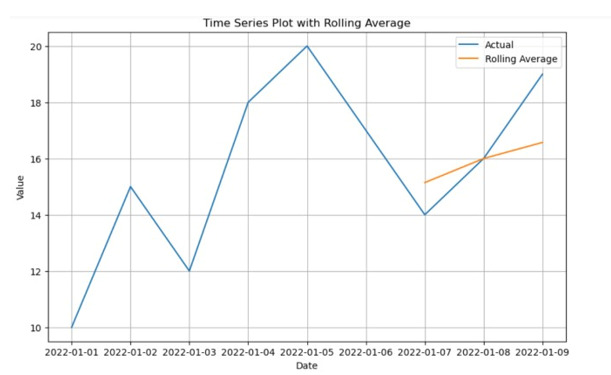
Step 8 ? Plot the actual time series data utilizing the sns.lineplot() with the 'value' column from the data DataFrame.
Step 9 ? Plot the rolling average utilizing sns.lineplot() with the rolling_avg variable.
Step 10 ? Put the x-axis label utilizing plt.xlabel().
Step 11 ? Put the y-axis label utilizing plt.ylabel().
Step 12 ? Put the title of the plot utilizing plt.title().
Step 13 ? Display a legend utilizing plt.legend().
Step 14 ? Put gridlines on the plot utilizing plt.grid(True).
Step 15 ? Display the plot utilizing plt.show().
Example
import pandas as pd
import seaborn as sns
import matplotlib.pyplot as plt

# Step 1: Fill the time series data with the csv file provided
data = pd.read_csv('your_data.csv')

#  Transform the column date to the object of DateTime
data['date'] = pd.to_datetime(data['date'])

# Put the column data as the index
data.set_index('date', inplace=True)

# Adjust the window size as per your requirement
# and then compute the rolling average
window_size = 7
# rolling_avg = data['value'].rolling(window=window_size).mean()

# Build the plot utilizing Seaborn
plt.figure(figsize=(10, 6))
# Adjust the figure size as needed
sns.lineplot(data=data['value'], label='Actual')
sns.lineplot(data=rolling_avg, label='Rolling Average')
plt.xlabel('Date')
plt.ylabel('Value')
plt.title('Time Series Plot with Rolling Average')
plt.legend()
plt.grid(True)
plt.show()
Output

Conclusion
Rolling average time series plots are simple to make by employing Python modules like Pandas and Matplotlib. We can successfully analyze trends and patterns in time-dependent data thanks to these visualizations. The clear code outlines how to import the data, transform the date column, compute the rolling average, and visualize the results. These methods give us the ability to understand the behavior of the data and make wise conclusions. Finance, economics, and climate research all use time series analysis and visualization as effective tools.

