
Article Categories
- All Categories
-
 Data Structure
-
 Networking
-
 RDBMS
RDBMS
-
 Operating System
-
 Java
Java
-
 MS Excel
-
 iOS
iOS
-
 HTML
HTML
-
 CSS
CSS
-
 Android
-
 Python
-
 C Programming
-
 C++
C++
-
 C#
C#
-
 MongoDB
-
 MySQL
MySQL
-
 Javascript
-
 PHP
PHP
-
 Economics & Finance
How to create correlation matrix plot without variables labels in R?
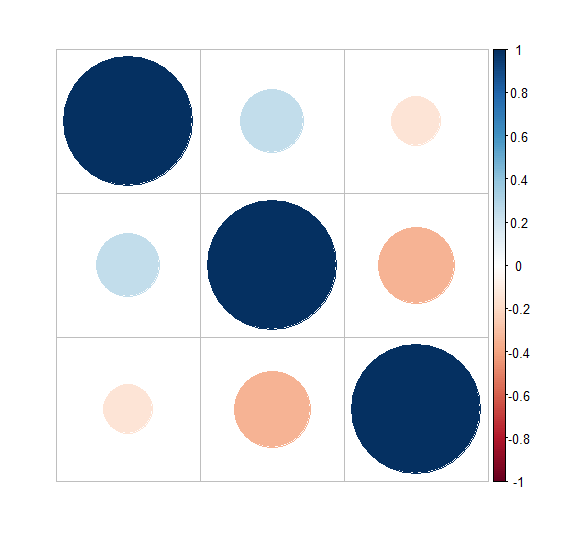
To create correlation matrix plot without variables labels in R, we can use tl.pos argument set to n.
For Example, if we have a correlation matrix say M then we can create the correlation matrix plot without variables labels by using the below command −
corrplot(M,tl.pos='n')
Example
Following snippet creates a sample data frame −
xThe following dataframe is created
x y z 1 6 36 895 2 4 61 342 3 0 51 222 4 4 23 934 5 0 18 744 6 7 88 888 7 0 27 999 8 3 89 153 9 8 32 452 10 7 80 237 11 6 82 877 12 5 14 980 13 5 76 630 14 4 39 345 15 8 12 229 16 4 31 817 17 1 57 375 18 5 7 531 19 6 84 343 20 0 9 968To find the correlation matrix for data in df on the above created data frame, add the following code to the above snippet −
xOutput
If you execute all the above given snippets as a single program, it generates the following Output −
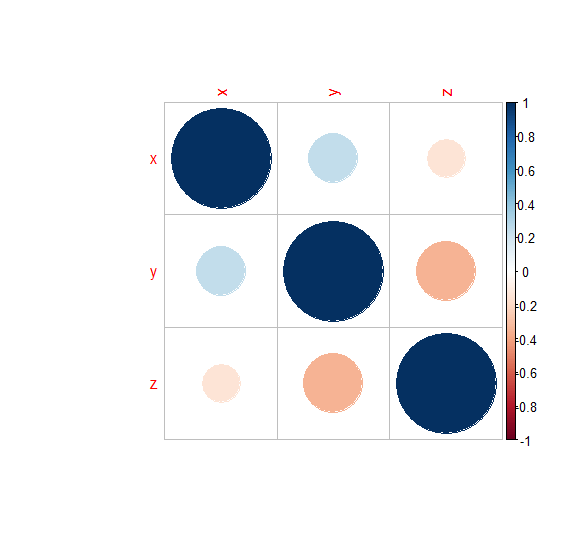
x y z x 1.0000000 0.2435002 -0.1497751 y 0.2435002 1.0000000 -0.3495930 z -0.1497751 -0.3495930 1.0000000To load corrplot package and creating correlation matrix plot on the above created data frame, add the following code to the above snippet −
xOutput
If you execute all the above given snippets as a single program, it generates the following Output −
To create correlation matrix plot without variables labels on the above created data frame, add the following code to the above snippet −
xOutput
If you execute all the above given snippets as a single program, it generates the following Output −

589 Views
