
Article Categories
- All Categories
-
 Data Structure
-
 Networking
-
 RDBMS
RDBMS
-
 Operating System
-
 Java
Java
-
 MS Excel
-
 iOS
iOS
-
 HTML
HTML
-
 CSS
CSS
-
 Android
-
 Python
-
 C Programming
-
 C++
C++
-
 C#
C#
-
 MongoDB
-
 MySQL
MySQL
-
 Javascript
-
 PHP
PHP
-
 Economics & Finance
Selected Reading
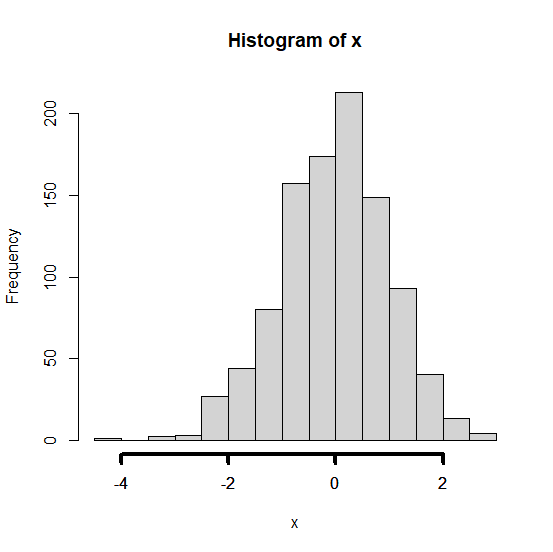
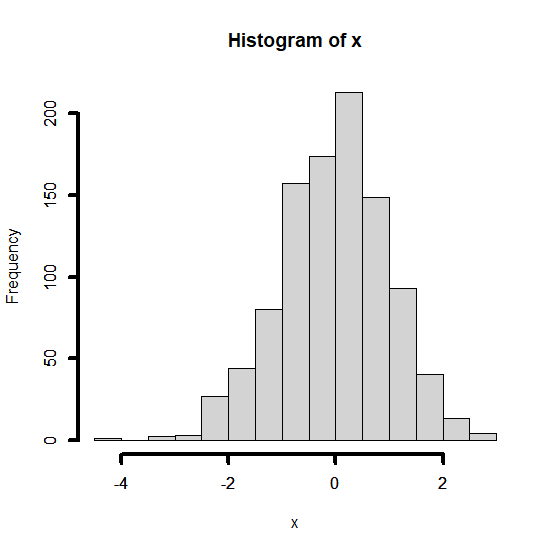
How to make the axes widths in a plot wider than default in base R?
The axes widths are generally very thin in plots but we can make them wider. This will be useful if we want to highlight the axes labels for reasons such as getting attention of the viewer on axes labels etc. To increase the width of the axes in a base R plot, we can use axis function and set the lwd argument.
Example
> x<-rnorm(1000)
> hist(x)
> axis(side=1,lwd=4)
Output:
Example
> axis(side=2,lwd=4)
Output:

Updated on: 2020-11-21T06:11:23+05:30
177 Views

Advertisements