
Article Categories
- All Categories
-
 Data Structure
-
 Networking
-
 RDBMS
RDBMS
-
 Operating System
-
 Java
Java
-
 MS Excel
-
 iOS
iOS
-
 HTML
HTML
-
 CSS
CSS
-
 Android
-
 Python
-
 C Programming
-
 C++
C++
-
 C#
C#
-
 MongoDB
-
 MySQL
MySQL
-
 Javascript
-
 PHP
PHP
-
 Economics & Finance
Selected Reading
How to create a plot in base R with mixed font of plot title such as default and italics?
We sometimes want to highlight the main title of a plot and one of the ways to do it is changing the font of the title to a unique or using a mixed font for the title. If we want to used mixed font then we need to use the appropriate font style for the title inside as shown in the below examples.
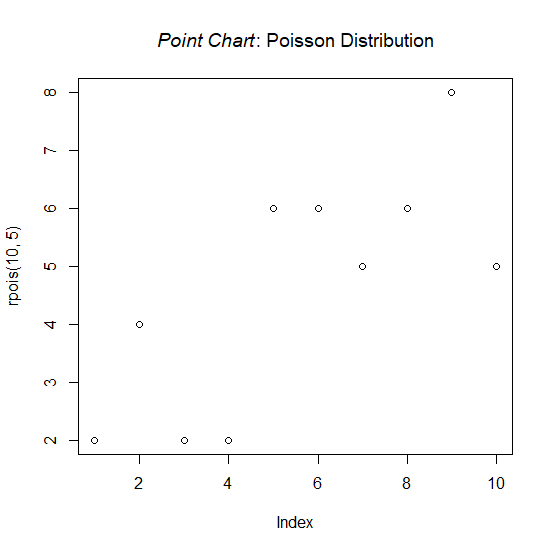
Example1
> plot(rpois(10,5),main=substitute(paste(italic("Point Chart"),": Poisson Distribution")))
Output:
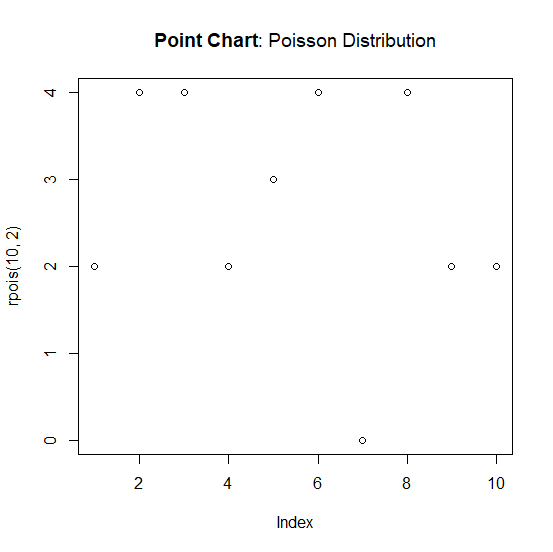
Example2
> plot(rpois(10,2),main=substitute(paste(bold("Point Chart"),": Poisson Distribution")))
Output:

Updated on: 2020-11-23T10:14:51+05:30
273 Views

Advertisements