
Article Categories
- All Categories
-
 Data Structure
-
 Networking
-
 RDBMS
RDBMS
-
 Operating System
-
 Java
Java
-
 MS Excel
-
 iOS
iOS
-
 HTML
HTML
-
 CSS
CSS
-
 Android
-
 Python
-
 C Programming
-
 C++
C++
-
 C#
C#
-
 MongoDB
-
 MySQL
MySQL
-
 Javascript
-
 PHP
PHP
-
 Economics & Finance
Selected Reading
How to create a base R plot without axes but keeping the frame of the plot?
To create a base R plot without axes but keeping the frame of the plot, we can set axes argument to FALSE and frame.plot argument to TRUE.
For example, if we have a vector called V and we want to create a plot of V without axes but with the frame of the plot then, we can use the command given below −
plot(V,axes=FALSE,frame.plot=TRUE)
Check out the below example to understand how it works.
Example
Consider the following snippet −
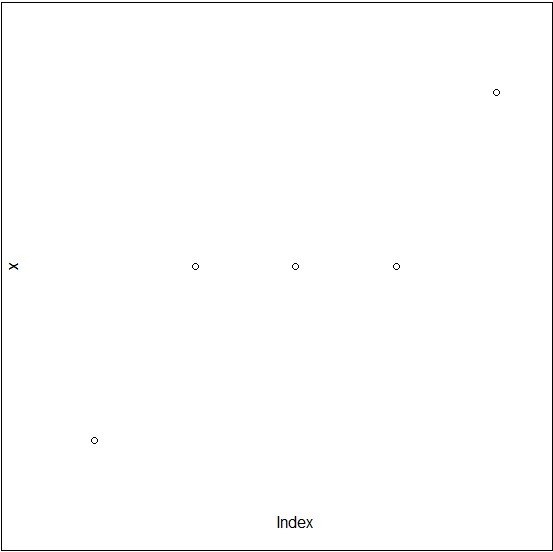
x<-rpois(5,2)
plot(x,axes=FALSE)
Output
If you execute the above given snippet, it generates the following Output −
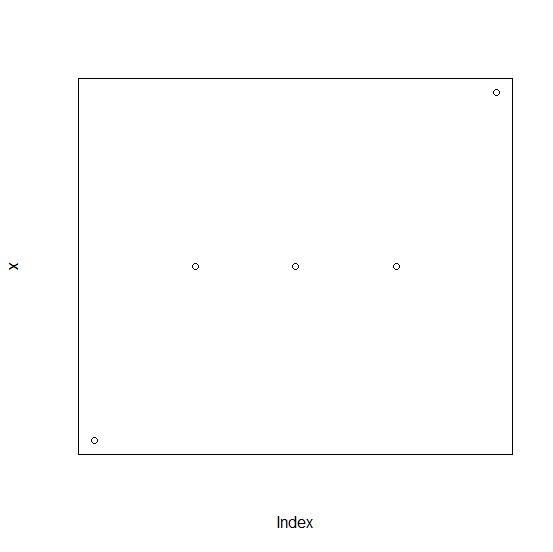
To create a base R plot without axes but keeping the frame of the plot, add the following code to the above snippet −
x<-rpois(5,2)
plot(x,axes=FALSE,frame.plot=TRUE)
Output
If you execute all the above given snippets as a single program, it generates the following Output −

Updated on: 2021-11-02T06:37:11+05:30
471 Views

Advertisements