 Data Structure
 Networking
 RDBMS
RDBMS Operating System
 Java
Java MS Excel
 iOS
iOS HTML
HTML CSS
CSS Android
 Python
 C Programming
 C++
C++ C#
C# MongoDB
 MySQL
MySQL Javascript
 PHP
PHP
- Selected Reading
- UPSC IAS Exams Notes
- Developer's Best Practices
- Questions and Answers
- Effective Resume Writing
- HR Interview Questions
- Computer Glossary
- Who is Who
How to Hide Axis Titles in Plotly Express Figure with Facets in Python?
Introduction
Plotly Express is a powerful data visualization library in Python that allows users to create interactive and expressive plots with ease. One common requirement when creating plots with facets (subplots) is the ability to hide the axis titles for each individual subplot. In this article, we will investigate various ways to deal with accomplish this involving Plotly Express in Python.
Syntax
how about we get to know the punctuation of the strategy we will use in the accompanying codes ?
import plotly.express as px

fig = px.scatter(data_frame, x="x_column", y="y_column", facet_row="row_column", facet_col="col_column", ...)
Algorithm
To hide axis titles in a Plotly Express figure with facets, we can follow the following step-by-step algorithm ?
Import the necessary libraries ? First, we need to import the required libraries, including plotly.express which will allow us to create the figure.
Load the data ? Next, we need to load the data that we want to visualize using Plotly Express.
Create the figure ? Using the px.scatter method, we can create a scatter plot figure with facets. We need to specify the x and y columns for the scatter plot, as well as the columns to facet the data rows and columns.
Customize the axis titles ? By default, Plotly Express automatically generates axis titles based on the column names. To hide the axis titles, we need to override the default titles with empty strings.
Show the figure ? Finally, we can display the figure using the fig.show() method.
Approach 1
In the first approach, we modify the figure's layout to hide the axis titles.
Example
import pandas as pd
import plotly.express as px

# Step 1: Import the necessary libraries
# Step 2: Load the data
data_frame = pd.read_csv("your_dataset.csv")  # Replace "your_dataset.csv" with the path to your actual CSV file

# Step 3: Create the figure
fig = px.scatter(data_frame, x="x_column", y="y_column", facet_row="row_column", facet_col="col_column")

# Step 4: Customize the axis titles
fig.update_layout(
   xaxis_title="",
   yaxis_title=""
)

# Step 5: Show the figure
fig.show()
Output

Explanation
Modifying the Figure's Layout ?
In this approach, we modify the figure's layout to hide the axis titles in a Plotly Express figure with facets. First, we import the necessary libraries, including pandas and plotly.express. Then, at that point, we load the information from a CSV record utilizing the pd.read_csv() capability and store it in the data_frame variable.
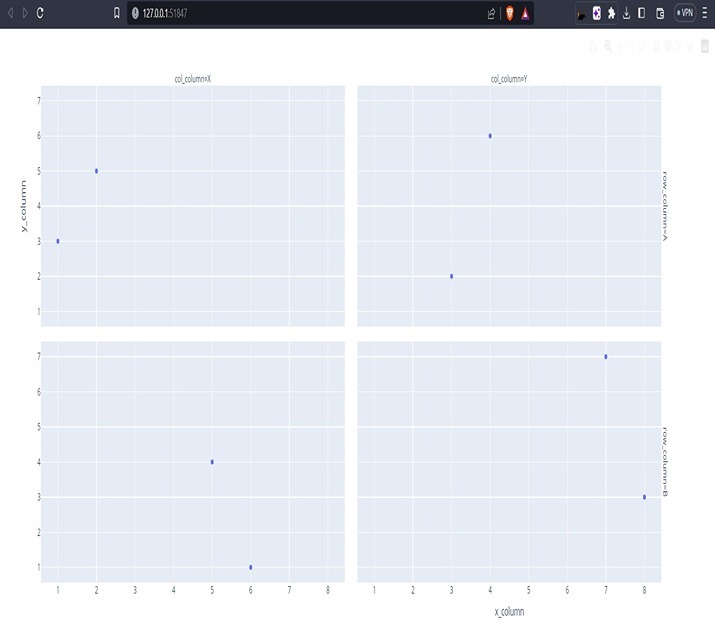
Then, we make the figure utilizing the px.scatter strategy.We specify the x and y columns for the scatter plot and use the facet_row and facet_col arguments to create facets based on the specified columns. This generates a scatter plot with separate subplots for each combination of facet values.
To hide the axis titles, we utilize the fig.update_layout() method. Within this method, we set the xaxis_title and yaxis_title to empty strings ("") to override the default axis titles. By doing so, we effectively remove the axis titles from the figure.
Finally, we display the modified figure using the fig.show() method. This will render the scatter plot with facets, where the axis titles for each subplot are hidden.
Approach 2
In the second approach, we will modify axis titles for subplot within the figure. Here's the code ?
Example
import pandas as pd
import plotly.express as px

# Step 1: Import the necessary libraries
# Step 2: Load the data
data_frame = pd.read_csv("your_dataset.csv")  # Replace "your_dataset.csv" with the path to your actual CSV file

# Step 3: Create the figure
fig = px.scatter(data_frame, x="x_column", y="y_column", facet_row="row_column", facet_col="col_column")

# Step 4: Customize the axis titles
for axis in fig.layout:
   if axis.startswith("xaxis") or axis.startswith("yaxis"):
      fig.layout[axis].title = ""

# Step 5: Show the figure
fig.show()
Output

Explanation
Modifying Axis Titles Directly ?
In this approach, we directly modify the axis titles of each subplot within the Plotly Express figure. After importing the necessary libraries and loading the data, we create the figure using the px.scatter method, similar to Approach 1.
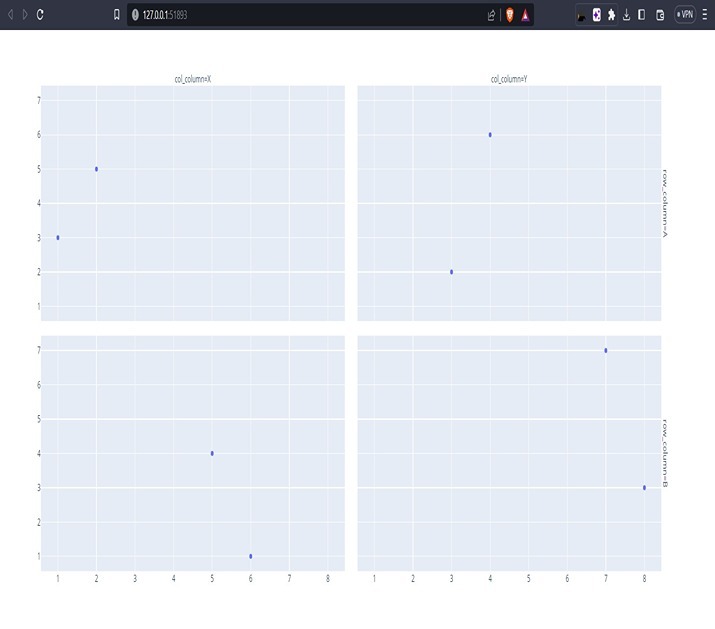
To conceal the pivot titles, we emphasize through the fig.layout and check for tomahawks that beginning with "xaxis" or "yaxis". These address the x-pivot and y-hub of each subplot in the figure. We access each axis using fig.layout[axis] and set the title attribute to an empty string ("") to hide the axis title.
By looping through the layout and modifying the axis titles, we effectively remove the titles from each subplot in the figure.
Finally, we display the modified figure using fig.show(), which will show the scatter plot with facets, where the axis titles for each subplot are hidden.
Both approaches achieve the goal of hiding axis titles in Plotly Express figures with facets. The choice between the approaches depends on personal preference and the specific requirements of the visualization. Approach 1 modifies the overall layout of the figure, while Approach 2 directly targets the axis titles of each subplot.
Conclusion
In this article, we explored two approaches to hide axis titles in a Plotly Express figure with facets in Python. By customizing the figure's layout or directly modifying the axis titles of each subplot, we can achieve the desired result. Plotly Express provides flexibility and ease of use when it comes to creating interactive plots, making it a popular choice for data visualization tasks. With these techniques, you can now create visually appealing facet plots without cluttered axis titles.

