 Data Structure
 Networking
 RDBMS
RDBMS Operating System
 Java
Java MS Excel
 iOS
iOS HTML
HTML CSS
CSS Android
 Python
 C Programming
 C++
C++ C#
C# MongoDB
 MySQL
MySQL Javascript
 PHP
PHP
- Selected Reading
- UPSC IAS Exams Notes
- Developer's Best Practices
- Questions and Answers
- Effective Resume Writing
- HR Interview Questions
- Computer Glossary
- Who is Who
How to Group Bar Charts in Python-Plotly?
Visualizing data is a critical step in understanding and interpreting complex data. Among numerous chart types, the bar chart remains a versatile and popular choice for representing categorical data. Using Python, a leading language in data analysis, and Plotly, a graphing library that enables interactive plots, we can create and customize bar charts, including grouped ones, with great ease and precision.
Today, we delve into the process of creating grouped bar charts in Python with Plotly. Grouped bar charts are used when comparing multiple series of categories across the same axes. This type of chart can provide a more comprehensive visual representation of complex data sets, helping to highlight patterns, correlations, and contrasts.
Syntax
The standard syntax for creating a grouped bar chart using Plotly's express function is as follows:
plotly.express.bar(data_frame, x, y, color, barmode = 'group', ...)
In this syntax:
data_frame - This is the DataFrame you're using as your data source.
x - The column in your DataFrame that represents the x-axis values.
y - The column in your DataFrame that represents the y-axis values.
color - The column that you want to use to group your data.
barmode - This should be set to 'group' for grouped bar charts. If not specified, the default setting is 'relative'.
...: Placeholder for additional parameters to customize your plot.
Algorithm
Let's break down the process of creating a grouped bar chart in Plotly into simple steps:
Import necessary libraries.
Create or import your data frame.
Specify the 'x', 'y', and 'color' parameters based on your DataFrame.
Use the plotly.express.bar() function to create your plot.
Set barmode to 'group'.
Customize your plot (optional).
Display your plot.
Approach 1: Grouped Bar Chart from Scratch
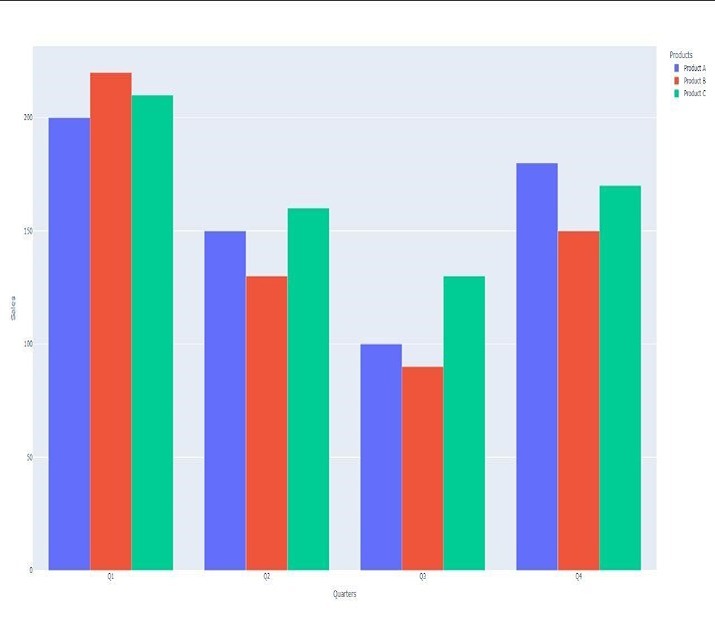
Suppose we have data for the sales of three different products (A, B, and C) over four quarters of a year. We want to represent this data in a grouped bar chart for better comparison.
Example
# Import necessary libraries
import plotly.express as px
import pandas as pd

# Create the DataFrame
data = {'Quarters': ['Q1', 'Q2', 'Q3', 'Q4'],
      'Product A': [200, 150, 100, 180],
      'Product B': [220, 130, 90, 150],
      'Product C': [210, 160, 130, 170]}

df = pd.DataFrame(data)

# Convert the DataFrame from wide to long format
df_melt = df.melt(id_vars='Quarters', var_name='Products', value_name='Sales')

# Create the grouped bar chart
fig = px.bar(df_melt, x='Quarters', y='Sales', color='Products', barmode='group')

# Show the plot
fig.show()
Output

Explanation
The essential library components are brought in on the first two lines. For the sake of brevity, we will refer to plotly.express as px. plotly.express is a straightforward and high-level interface for the Plotly program. Additionally, we bring in pandas, a robust package for data manipulation and analysis that we refer to by its alias, pd.
Then, we construct a dictionary that we'll refer to as data, and it will have entries for the sales of three different items ('A,' 'B,' and 'C') spanning four different quarters ('Q1' to 'Q4'). Following that, we transform this dictionary into a pandas DataFrame df.
The function known as melt() is utilized in order to transform the DataFrame from its wide format into its long format. The column(s) that are to stay unaltered are determined by the id_vars argument, while the names of the recently produced columns are indicated by the var_name and value_name boundaries, separately.
While making a bar plot, the px.bar() technique is called upon to do the hard work. The x parameter, the y parameter, and the variety parameter each characterize the column(s) in the DataFrame that will be utilized to characterize the gathering tone, the x-axis, and the y-axis, separately. In order to make a grouped bar chart, the barmode is changed to the group setting.
The plot is presented by calling the show() function for the very last time.
Approach 2: Grouped Bar Chart From External Data
Suppose we have an external CSV file ('sales_data.csv') containing sales data for different regions and products.
Example
# Import necessary libraries
import plotly.express as px
import pandas as pd

# Load the DataFrame from an external CSV file
df = pd.read_csv('sales_data.csv')

# Create the grouped bar chart
fig = px.bar(df, x='Region', y='Sales', color='Product', barmode='group')

# Customize the plot
fig.update_layout(title_text='Sales by Product and Region',
                  xaxis_title='Region',
                  yaxis_title='Sales')

# Show the plot
fig.show()
Output

Explanation
Bringing in the fundamental libraries is where we start, very much as we did in the principal way.
In this occasion, as opposed to producing our own DataFrame, we load it from an outside CSV document with the pd.read_csv() function, which then at that point changes the record into a DataFrame.
We produce a gathered bar graph in a way that is practically equivalent to the primary strategy, with the special case that we use segment names that are novel to the DataFrame that we have recently made.
It is feasible to customize the plot with the use of the update_layout() function. Right now, we will give the graph a title, and afterward we will mark the x-pivot and the y-hub.
In the last step, the plot will be introduced.
Conclusion
Grouped bar charts are incredibly useful for comparing multiple data series across the same categories. Using Python and Plotly, we can easily generate these plots from either pre-existing or newly created data sets. The customization options in Plotly allow for adjustments according to our specific visual and interpretive needs.
Keep in mind, visual information examination isn't just about making pretty outlines; it's additionally about really imparting complex data. In this way, cautious consideration to be given to the decision of plot types, variety plans, and plan components to guarantee that your information story is pretty much as clear and convincing as could really be expected. By mastering grouped bar charts, you are adding a powerful tool to your data visualization toolbox. Happy plotting!

