 Data Structure
 Networking
 RDBMS
RDBMS Operating System
 Java
Java MS Excel
 iOS
iOS HTML
HTML CSS
CSS Android
 Python
 C Programming
 C++
C++ C#
C# MongoDB
 MySQL
MySQL Javascript
 PHP
PHP
- Selected Reading
- UPSC IAS Exams Notes
- Developer's Best Practices
- Questions and Answers
- Effective Resume Writing
- HR Interview Questions
- Computer Glossary
- Who is Who
How to Add Legends to charts in Python?
Introduction...
The main purpose of charts is to make understand data easily. "A picture is worth a thousand words" means complex ideas that cannot be expressed in words can be conveyed by a single image/chart.
When drawing graphs with lot of information, a legend may be pleasing to display relevant information to improve the understanding of the data presented.
How to do it..
In matplotlib, legends can be presented in multiple ways. Annotations to draw attention to specific points are also useful to help the reader understand the information displayed on the graph.
1. Install matplotlib by opening up the python command prompt and firing pip install matplotlib.
2. Prepare the data to be displayed.
Example
import matplotlib.pyplot as plt

# data prep (I made up data no accuracy in these stats)
mobile = ['Iphone','Galaxy','Pixel']

# Data for the mobile units sold for 4 Quaters in Million
units_sold = (('2016',12,8,6),
('2017',14,10,7),
('2018',16,12,8),
('2019',18,14,10),
('2020',20,16,5),)
3. Split the data into arrays for each company company's mobile units.
Example
# data prep - splitting the data
IPhone_Sales = [Iphones for Year, Iphones, Galaxy, Pixel in units_sold]
Galaxy_Sales = [Galaxy for Year, Iphones, Galaxy, Pixel in units_sold]
Pixel_Sales = [Pixel for Year, Iphones, Galaxy, Pixel in units_sold]

# data prep - Labels
Years = [Year for Year, Iphones, Galaxy,Pixel in units_sold]

# set the position
Position = list(range(len(units_sold)))

# set the width
Width = 0.2
4. Creating a Bar graph with the data prepared.Each product sales gets a call to .bar, specifying its position and sales.
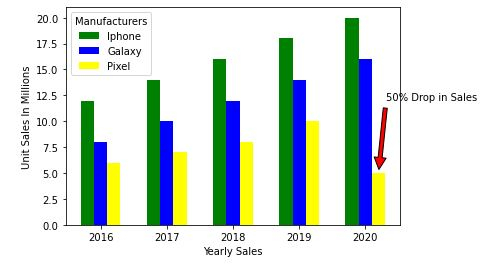
Annotation is added using the xy and xytext attributes. Looking at the data, the Google Pixel mobile sales have dropped by 50% i.e. from 10Million units sold in 2019 to just 5Million in 2022. So we are going to set the text and annotation to out last bar.
Finally, we will add the legend using the legend parameter.By default, matplotlib will draw the legend over an area where there's the least overlap of data.
Example
plt.bar([p - Width for p in Position], IPhone_Sales, width=Width,color='green')
plt.bar([p for p in Position], Galaxy_Sales , width=Width,color='blue')
plt.bar([p + Width for p in Position], Pixel_Sales, width=Width,color='yellow')

# Set X-axis as years
plt.xticks(Position, Years)

# Set the Y axis label
plt.xlabel('Yearly Sales')
plt.ylabel('Unit Sales In Millions')

# Set the annotation Use the xy and xytext to change the arrow
plt.annotate('50% Drop in Sales', xy=(4.2, 5), xytext=(5.0, 12),
horizontalalignment='center',
arrowprops=dict(facecolor='red', shrink=0.05))

# Set the legent
plt.legend(mobile, title='Manufacturers')
Output
<matplotlib.legend.Legend at 0x19826618400>

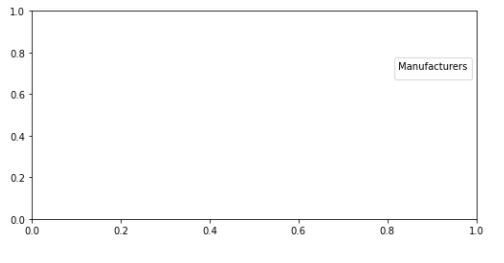
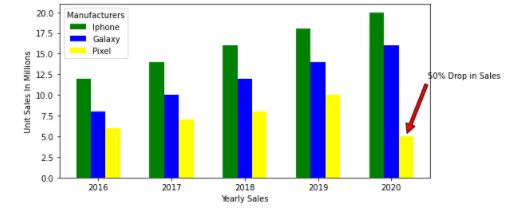
If you feel adding the legend inside the chart is noisy, you can use the bbox_to_anchor option to plot the legend outside. bbox_to_anchor have (X, Y) positions, where 0 is the bottom-left corner of the graph and 1 is the upper-right corner.
NOTE: - Use .subplots_adjust to adjust the legend where the graph starts and ends.
E.g. right=0.50 value means it leave 50% of the screen on the right of the plot. The default value for left is 0.125, meaning it leaves 12.5% of the space on the left.
Output
plt.legend(mobile, title='Manufacturers', bbox_to_anchor=(1, 0.8))
plt.subplots_adjust(right=1.2)

Example
6. Finally let us save the figure.
import matplotlib.pyplot as plt

# data prep (I made up data no accuracy in these stats)
mobile = ['Iphone','Galaxy','Pixel']

# Data for the mobile units sold for 4 Quaters in Million
units_sold = (('2016',12,8,6),
('2017',14,10,7),
('2018',16,12,8),
('2019',18,14,10),
('2020',20,16,5),)

# data prep - splitting the data
IPhone_Sales = [Iphones for Year, Iphones, Galaxy, Pixel in units_sold]
Galaxy_Sales = [Galaxy for Year, Iphones, Galaxy, Pixel in units_sold]
Pixel_Sales = [Pixel for Year, Iphones, Galaxy, Pixel in units_sold]

# data prep - Labels
Years = [Year for Year, Iphones, Galaxy,Pixel in units_sold]

# set the position
Position = list(range(len(units_sold)))

# set the width
Width = 0.2

plt.bar([p - Width for p in Position], IPhone_Sales, width=Width,color='green')
plt.bar([p for p in Position], Galaxy_Sales , width=Width,color='blue')
plt.bar([p + Width for p in Position], Pixel_Sales, width=Width,color='yellow')

# Set X-axis as years
plt.xticks(Position, Years)

# Set the Y axis label
plt.xlabel('Yearly Sales')
plt.ylabel('Unit Sales In Millions')

# Set the annotation Use the xy and xytext to change the arrow
plt.annotate('50% Drop in Sales', xy=(4.2, 5), xytext=(5.0, 12),
horizontalalignment='center',
arrowprops=dict(facecolor='red', shrink=0.05))

# Set the legent
plt.legend(mobile, title='Manufacturers')

plt.legend(mobile, title='Manufacturers')
plt.subplots_adjust(right=1.2)

# plt.show()
plt.savefig('MobileSales.png')


