
Article Categories
- All Categories
-
 Data Structure
-
 Networking
-
 RDBMS
RDBMS
-
 Operating System
-
 Java
Java
-
 MS Excel
-
 iOS
iOS
-
 HTML
HTML
-
 CSS
CSS
-
 Android
-
 Python
-
 C Programming
-
 C++
C++
-
 C#
C#
-
 MongoDB
-
 MySQL
MySQL
-
 Javascript
-
 PHP
PHP
-
 Economics & Finance
Selected Reading
How to create a heatmap for lower triangular matrix in R?
A heatmap is a diagrammatic representation of data where the values are represented with colours. Mostly, it is used to display data that has slight variation. We can draw it for a full matrix, an upper triangular matrix as well as a lower triangular matrix. This can be done with the help of image function.
Example1
> M1<-matrix(rpois(36,5),ncol=6)
> M1
Output
   [,1] [,2] [,3] [,4] [,5] [,6]
[1,] 6    9    4    7    5    4
[2,] 6    6    4    3    7    5
[3,] 2    6    1    2    2    5
[4,] 5    6    2    4    3    5
[5,] 2   10    3    4    5    6
[6,] 5    6    6    4    4    3
Example
> M1[upper.tri(M1)]=NA
> M1
Output
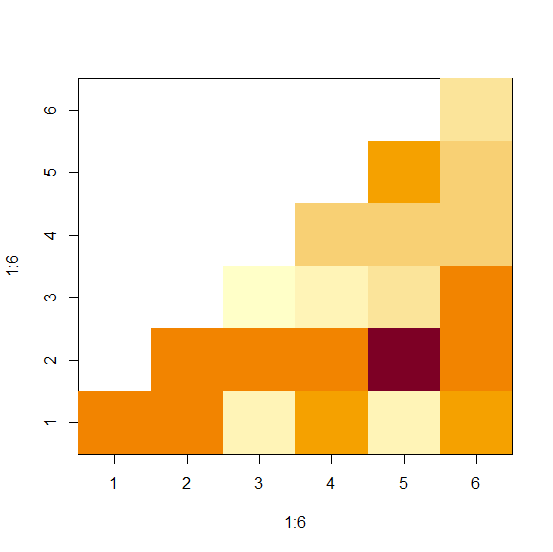
   [,1] [,2] [,3] [,4] [,5] [,6]
[1,] 6   NA   NA   NA   NA   NA
[2,] 6    6   NA   NA   NA   NA
[3,] 2    6   1    NA   NA   NA
[4,] 5    6   2    4    NA   NA
[5,] 2   10   3    4     5   NA
[6,] 5    6   6    4     4    3
Example
> image(1:6,1:6,M1)
Output:
Example2
> M2<-matrix(rnorm(25,1,0.24),nrow=5)
> M2
Output
     [,1]         [,2]       [,3]     [,4]     [,5]
[1,] 1.0839897 0.4979137 0.8792797 1.0867854 1.067157
[2,] 0.9422221 1.2385106 0.8464642 1.0249176 0.689996
[3,] 1.0664669 0.7912711 1.1352022 1.2694327 1.200055
[4,] 1.2765053 1.2013291 1.0647500 0.9837964 1.181706
[5,] 1.1613147 1.2735703 1.4184856 1.1998669 1.072919
Example
> M2[upper.tri(M2)]=NA
> M2
Output
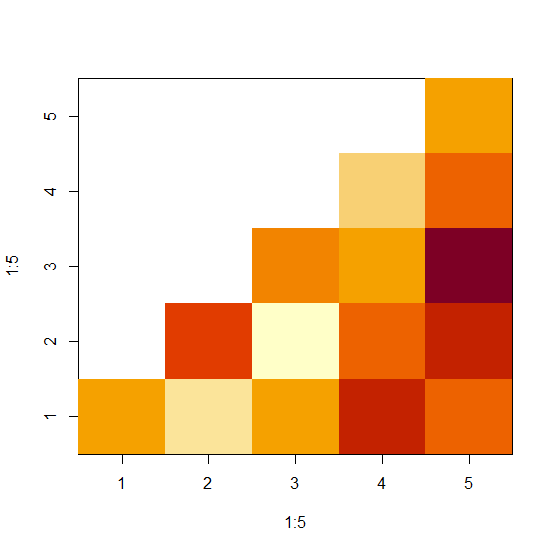
[,1] [,2] [,3] [,4] [,5]
[1,] 1.0839897 NA NA NA NA
[2,] 0.9422221 1.2385106 NA NA NA
[3,] 1.0664669 0.7912711 1.135202 NA NA
[4,] 1.2765053 1.2013291 1.064750 0.9837964 NA
[5,] 1.1613147 1.2735703 1.418486 1.1998669 1.072919
Example
> image(1:5,1:5,M2)
Output:

Updated on: 2026-03-11T22:50:53+05:30
1K+ Views

Advertisements