
Article Categories
- All Categories
-
 Data Structure
-
 Networking
-
 RDBMS
RDBMS
-
 Operating System
-
 Java
Java
-
 MS Excel
-
 iOS
iOS
-
 HTML
HTML
-
 CSS
CSS
-
 Android
-
 Python
-
 C Programming
-
 C++
C++
-
 C#
C#
-
 MongoDB
-
 MySQL
MySQL
-
 Javascript
-
 PHP
PHP
-
 Economics & Finance
Selected Reading
How to set the range for boxplot in base R?
By default, R considers the vector or the data frame column values. But if we want to set the range for boxplot in base R, we can use ylim argument within the boxplot function. For example, if we have a vector called x that contains values starting from 21 to 50 and we want to have the range in the boxplot starting from 1 to 100 then we can use the command
boxplot(x,ylim=c(1,100))
Example
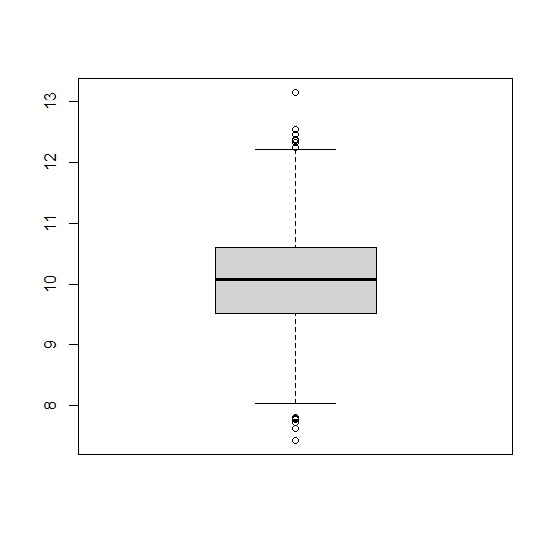
x<-rnorm(500,10,1)
boxplot(x)
Output
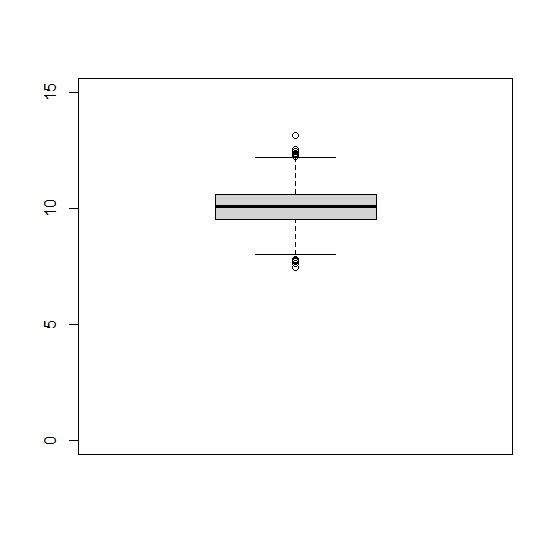
Example
boxplot(x,ylim=c(0,15))
Output
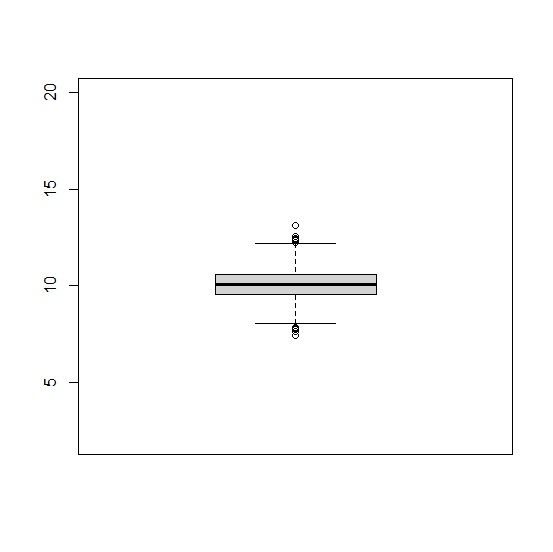
Example
boxplot(x,ylim=c(2,20))
Output

Updated on: 2026-03-11T22:50:56+05:30
2K+ Views

Advertisements