
Article Categories
- All Categories
-
 Data Structure
-
 Networking
-
 RDBMS
RDBMS
-
 Operating System
-
 Java
Java
-
 MS Excel
-
 iOS
iOS
-
 HTML
HTML
-
 CSS
CSS
-
 Android
-
 Python
-
 C Programming
-
 C++
C++
-
 C#
C#
-
 MongoDB
-
 MySQL
MySQL
-
 Javascript
-
 PHP
PHP
-
 Economics & Finance
Selected Reading
How to create a Venn diagram in R?
A Venn diagram helps to identify the common and uncommon elements between two or more than two sets of elements. This is also used in probability theory to visually represent the relationship between two or more events. To create a Venn diagram in R, we can make use of venn function of gplots package.
Example
Consider the below vectors
x<-c(rep(c(1,2,3),times=c(4,5,8)),12,15,20)
y<-c(1:10,25)
Installing and loading gplots package −
install.packages("gplots")
library(gplots)
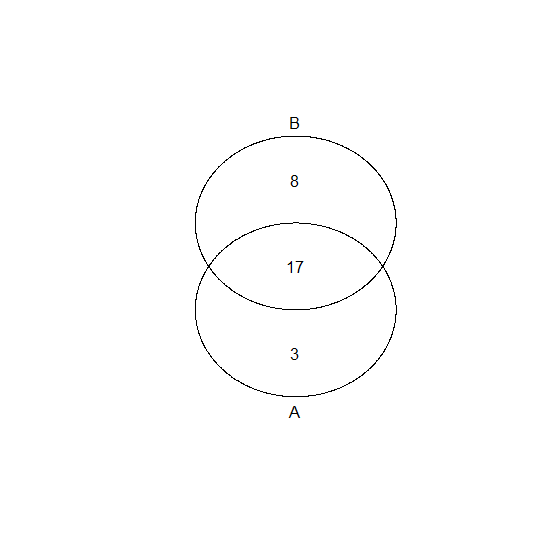
Creating the Venn diagram for x and y −
venn(list(x,y))
Output
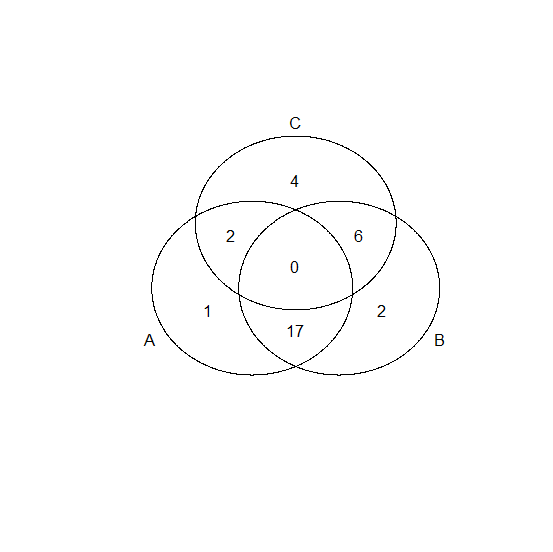
If we have three variables then we will just add the third variable in venn function as shown below −
z<-c(5:15,21)
venn(list(x,y,z))
Output

Updated on: 2020-08-21T06:11:50+05:30
557 Views

Advertisements