
Article Categories
- All Categories
-
 Data Structure
-
 Networking
-
 RDBMS
RDBMS
-
 Operating System
-
 Java
Java
-
 MS Excel
-
 iOS
iOS
-
 HTML
HTML
-
 CSS
CSS
-
 Android
-
 Python
-
 C Programming
-
 C++
C++
-
 C#
C#
-
 MongoDB
-
 MySQL
MySQL
-
 Javascript
-
 PHP
PHP
-
 Economics & Finance
Selected Reading
How to create colored Venn Diagrams?
Reading transparent Venn Diagrams is a little difficult due to transparency in all areas, therefore, we should create Venn Diagrams that has different color in each of the area. This will help us to easily read the diagram and also the diagram will be more appealing to viewers. We can do this by using venn.diagram function of VennDiagram package.
Installing and Loading VennDiagram package −
Example
install.packages(“VennDiagram”)
library(VennDiagram)
Creating the colored Venn Diagram (Note: The colored diagram will be saved in default folder for R in your system, mostly it is documents folder) −
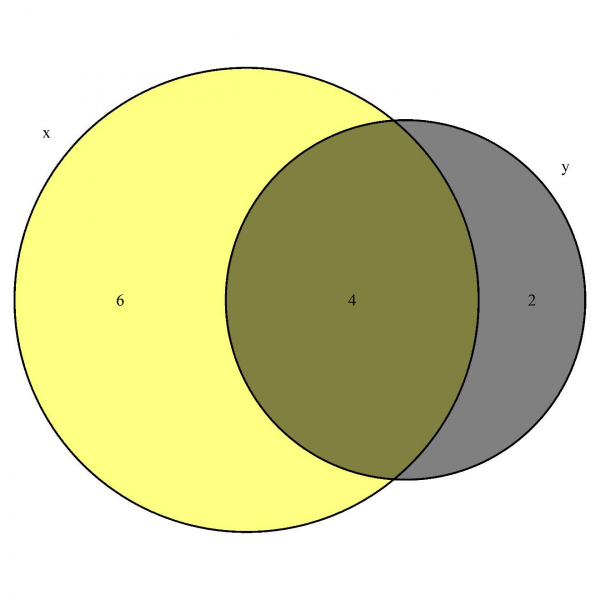
venn.diagram(list(x=1:10,y=7:12),fill=c("yellow","black"),
+ filename = "Example1.tiff")
Output
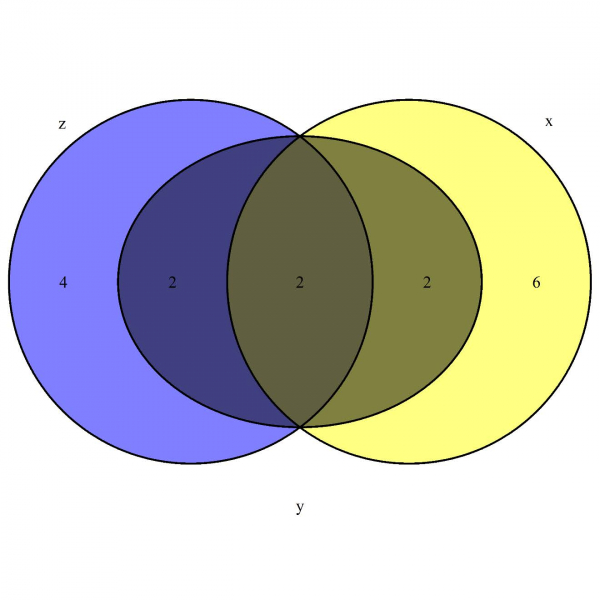
venn.diagram(list(x=1:10,y=7:12,z=9:16),fill=c("yellow","black","blue"),
+ filename = "Example2.tiff")
Output
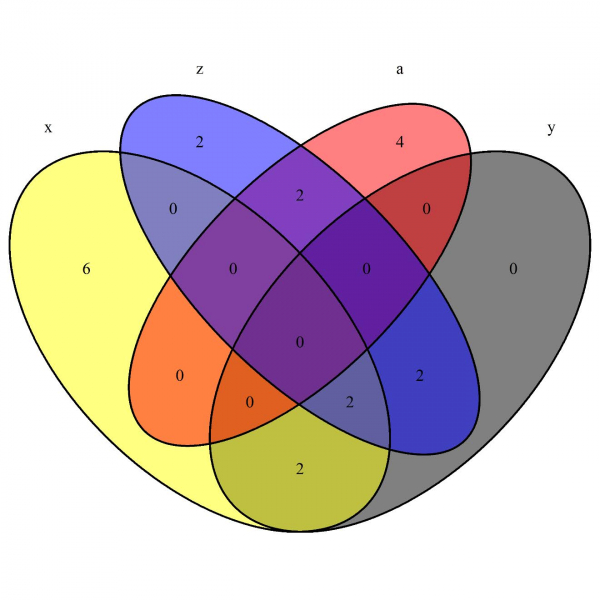
venn.diagram(list(x=1:10,y=7:12,z=9:16,a=15:20),fill=c("yellow","black","blue","red"),
+ filename = "Example3.tiff")
Output

Updated on: 2020-08-21T11:16:13+05:30
527 Views

Advertisements