 Data Structure
 Networking
 RDBMS
RDBMS Operating System
 Java
Java MS Excel
 iOS
iOS HTML
HTML CSS
CSS Android
 Python
 C Programming
 C++
C++ C#
C# MongoDB
 MySQL
MySQL Javascript
 PHP
PHP
- Selected Reading
- UPSC IAS Exams Notes
- Developer's Best Practices
- Questions and Answers
- Effective Resume Writing
- HR Interview Questions
- Computer Glossary
- Who is Who
How to Create and Customize Venn Diagrams in Python?
Venn diagrams are diagrams used to represent the relationships between sets. To create Venn diagrams, we are going to use matplotlib.
Matplotlib is a popular data visualization library used in Python to create interactive plots and charts. It is also used to make interactive figures and diagrams. Matplotlib provides a number of functions to customize plots and diagrams. In this tutorial, we will illustrate three examples to customize Venn diagrams.
Example
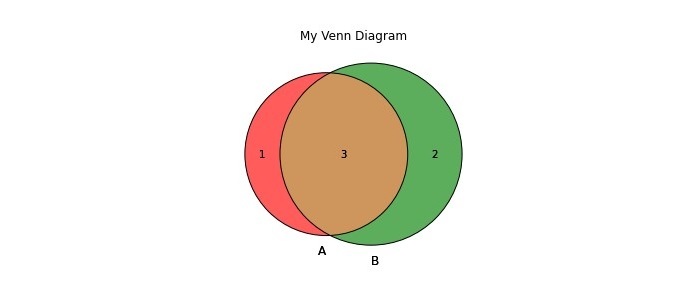
Here's a simple example that creates an intersection of two Venn diagrams; first, we imported necessary libraries and imported venns. Then we created data sets as Python sets, and after that, we created a Venn diagram using ?venn2()' function. Next, we customized our diagram by setting linewidth to 1 by using ?lw'; lastly, we represented the diagram using ?plt.show()'; finally this code shows a simple intersection of two venns.
import matplotlib.pyplot as plt
from matplotlib_venn import venn2, venn2_circles, venn3, venn3_circles
set1 = set(['A' , 'B', 'C', 'D'])
set2 = set(['B', 'C', 'D', 'E', 'F'])
set3 = set(['C', 'E', 'F', 'G'])
venn2([set1, set2])
venn2([set1, set2])
venn2_circles([set1, set2], lw=1)
plt.title("My Venn Diagram")
plt.show()
Output

Example
This example demonstrates three disjoint venn diagrams as ?cir1','cir2', and ?cir3'. In this example, we first imported venns and matplotlib, then we created three data sets and set different elements in different venns. We represented it as venn using the ?venn3()' function, and lastly, we plotted it using ?plt. show()'.
import matplotlib.pyplot as plt
from matplotlib_venn import venn3

# create sets for primary colors
cir1 = set(['apple', 'cherry', 'strawberry'])
cir2 = set(['banana', 'lemon', 'pineapple'])
cir3 = set(['blueberry', 'grape', 'plum'])

# create Venn diagram
venn3([cir1, cir2, cir3], ('cir1', 'cir2', 'cir3'))

# display the diagram
plt.show()
Output

Example
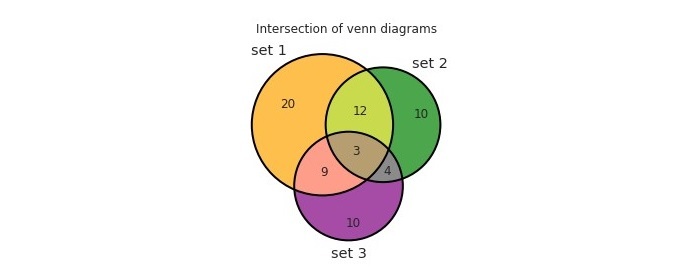
This example demonstrates three intersection venn diagrams as ?set 1','set 2', and ?set 3', then we depicted venns using ?venn3()', we also labelled it using ?set_labels()' and set it colors to different colours. Next, we gave an outline of linewidth 2 using ?linewidth'. Finally, we set the title to ?Intersection of venn diagrams' and then plotted it using ?plt.show()'.
from matplotlib_venn import venn3, venn3_circles
from matplotlib import pyplot as plt
venn3(subsets=(20, 10, 12, 10, 9, 4, 3), set_labels=('set 1', 'set 2', 'set 3'), set_colors=("orange", "green", "purple"), alpha=0.7)
venn3_circles(subsets=(20, 10, 12, 10, 9, 4, 3), linewidth=2)
plt.title("Intersection of venn diagrams")
plt.show()
Output

We learned that Matplotlib is a very powerful library for creating Venn diagrams; it provides a number of functions to customize Venn diagrams for depicting information; developers can easily create Venn diagrams using this python library and customize the Venn diagram further by changing the colors of the circles, adjusting the font size and style, Venn diagrams are very helpful for visually representing the relationships between multiple sets. It has several advantages; it helps to visualize information and understand and remember complex topics. Mathematicians use it to present complex data easily

