
Article Categories
- All Categories
-
 Data Structure
-
 Networking
-
 RDBMS
RDBMS
-
 Operating System
-
 Java
Java
-
 MS Excel
-
 iOS
iOS
-
 HTML
HTML
-
 CSS
CSS
-
 Android
-
 Python
-
 C Programming
-
 C++
C++
-
 C#
C#
-
 MongoDB
-
 MySQL
MySQL
-
 Javascript
-
 PHP
PHP
-
 Economics & Finance
Selected Reading
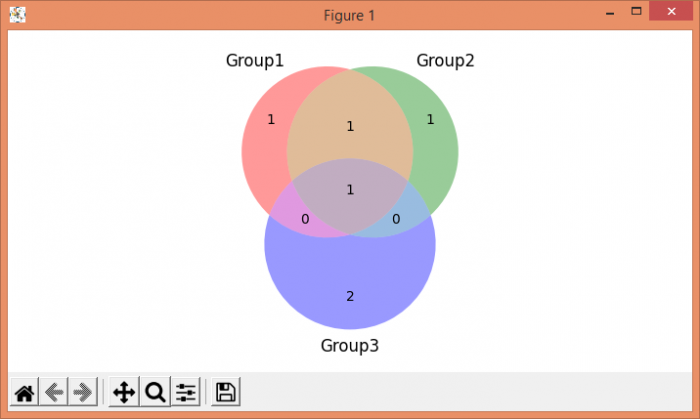
Python Matplotlib Venn diagram
To plot a Venn diagram, first install Venn diagram using command "pip install matplotlib-venn". Using venn3, plot a 3-set area-weighted Venn diagram.
Steps
Create 3 sets.
Using venn3, make a Venn diagram.
To display the figure, use show() method.
Example
import matplotlib.pyplot as plt
from matplotlib_venn import venn3
plt.rcParams["figure.figsize"] = [7.00, 3.50]
plt.rcParams["figure.autolayout"] = True
set1 = {'A', 'B', 'C'}
set2 = {'A', 'B', 'D'}
set3 = {'A', 'E', 'F'}
venn3([set1, set2, set3], ('Group1', 'Group2', 'Group3'))
plt.show()
Output

Updated on: 2021-05-06T13:50:18+05:30
2K+ Views

Advertisements