
Article Categories
- All Categories
-
 Data Structure
-
 Networking
-
 RDBMS
RDBMS
-
 Operating System
-
 Java
Java
-
 MS Excel
-
 iOS
iOS
-
 HTML
HTML
-
 CSS
CSS
-
 Android
-
 Python
-
 C Programming
-
 C++
C++
-
 C#
C#
-
 MongoDB
-
 MySQL
MySQL
-
 Javascript
-
 PHP
PHP
-
 Economics & Finance
How to plot matrix elements using corrplot in R?
To create a plot of matrix elements with the help of corrplot function, we would need to set is.corr argument to FALSE so that the matrix values will be plotted in the diagram, otherwise, the corrplot function requires correlation matrix instead of a matrix hence there will be an error as shown in the Example below.
Example
Consider the matrix given below −
M<-matrix(round(rnorm(80),2),ncol=4)
M
The following dataframe is created
        [,1] [,2]   [,3] [,4]
 [1,]  0.23 -1.24 -1.10 -0.54
 [2,]  0.82  0.78 -0.03 -0.49
 [3,] -1.52  0.81 -0.80  0.29
 [4,]  2.23 -0.43 -2.81  1.41
 [5,] -0.86 -1.05  0.59  0.37
 [6,] -0.77 -0.22  1.17 -0.43
 [7,]  0.50  0.27  1.95  0.50
 [8,]  0.91  0.69  0.40  1.71
 [9,]  0.13 -0.33 -0.37 -0.65
[10,]  0.71 -0.56  0.06  0.23
[11,] -0.42  1.44  1.38  1.97
[12,]  0.49 -0.21  0.41  0.67
[13,]  0.56  1.11 -1.13 -0.23
[14,] -1.65  0.42  0.06 -0.49
[15,]  1.38  0.20  1.01 -1.33
[16,] -0.68 -0.71 -0.38 -0.16
[17,]  0.22 -1.62 -0.63  0.59
[18,]  0.75  1.04 -2.03 -0.97
[19,]  0.64  1.79 -0.02 -0.17
[20,]  1.11  0.04  0.67  1.19
To load the corrplot package and create a plot of matrix M on the above created data frame, add the following code to the above snippet −
M<-matrix(round(rnorm(80),2),ncol=4)
library(corrplot)
corrplot(M)
Output
If you execute all the above given snippets as a single program, it generates the following Output −
Error in corrplot(M) : The matrix is not in [-1, 1]!
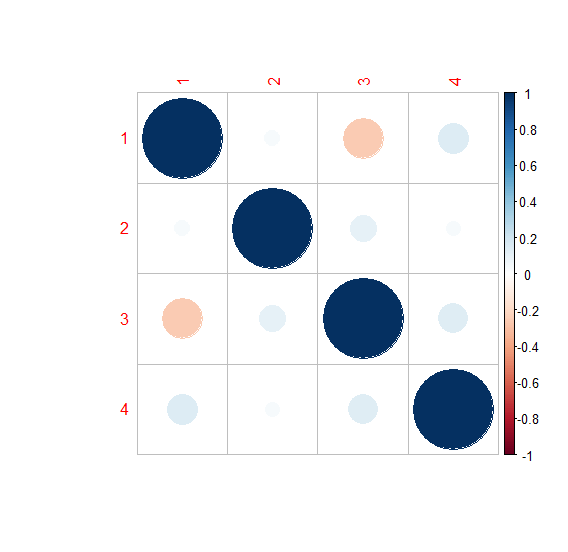
To create a plot of correlation matrix M on the above created data frame, add the following code to the above snippet −
M<-matrix(round(rnorm(80),2),ncol=4)
library(corrplot)
corrplot(cor(M))
Output
If you execute all the above given snippets as a single program, it generates the following Output −
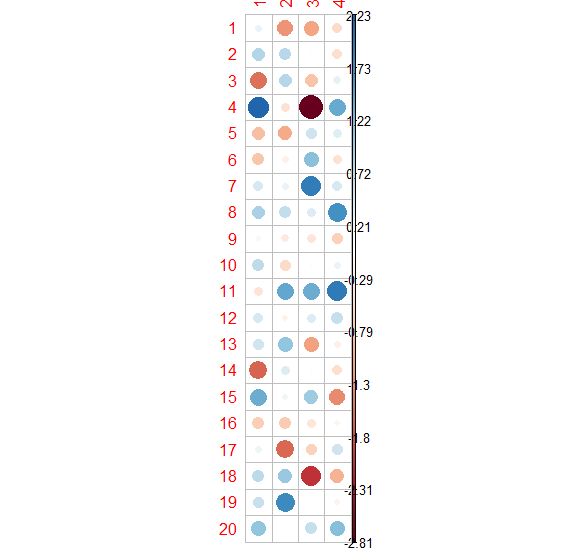
To create a plot of matrix M on the above created data frame, add the following code to the above snippet −
M<-matrix(round(rnorm(80),2),ncol=4)
library(corrplot)
corrplot(M,is.corr=FALSE)
Output
If you execute all the above given snippets as a single program, it generates the following Output −

3K+ Views
