
Article Categories
- All Categories
-
 Data Structure
-
 Networking
-
 RDBMS
RDBMS
-
 Operating System
-
 Java
Java
-
 MS Excel
-
 iOS
iOS
-
 HTML
HTML
-
 CSS
CSS
-
 Android
-
 Python
-
 C Programming
-
 C++
C++
-
 C#
C#
-
 MongoDB
-
 MySQL
MySQL
-
 Javascript
-
 PHP
PHP
-
 Economics & Finance
Selected Reading
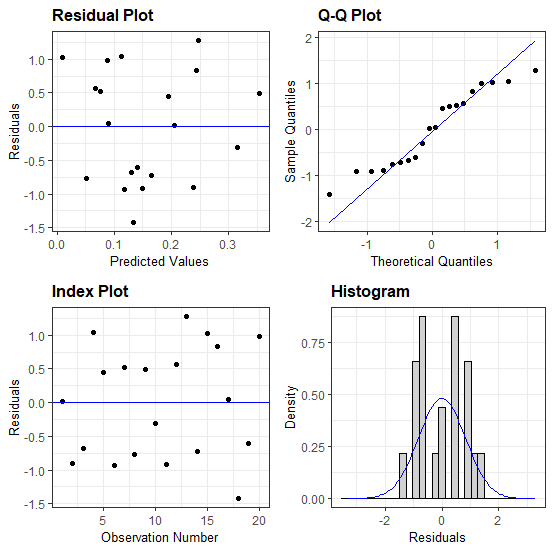
How to create a residual plot in R with better looking aesthetics?
The default residual plot can be created by using the model object name in base R but that is not very attractive. To create a residual plot with better looking aesthetics, we can use resid_panel function of ggResidpanel package. It is created in the same way as the residual plot in base R, also it results in all the relevant graph in one window.
Example
Consider the below data frame −
> x<-rnorm(20)
> y<-rnorm(20)
> df<-data.frame(x,y)
> df
Output
x y
1 0.48508894 0.217379409
2 0.75113573 -0.657179470
3 -0.13075185 -0.549613217
4 -0.26867557 1.156736294
5 0.40407850 0.640387394
6 -0.23816272 -0.807847198
7 -0.57278583 0.600249694
8 -0.78222676 -0.711133218
9 1.70161645 0.843898300
10 1.38489941 0.007269587
11 0.02057673 -0.771582102
12 -0.64580925 0.635760620
13 0.82489995 1.528871204
14 0.15353169 -0.554865220
15 -1.12280936 1.034474607
16 0.80230963 1.071006553
17 -0.45834453 0.134977920
18 -0.09765087 -1.290718839
19 -0.04070513 -0.471208528
20 -0.47139575 1.071669012
Example
> Model<-lm(y~x,data=df)
Loading ggResidpanel package and creating the residual plot −
Example
> library(ggResidpanel)
> resid_panel(Model)
Output

Updated on: 2026-03-11T22:50:54+05:30
429 Views

Advertisements