
Article Categories
- All Categories
-
 Data Structure
-
 Networking
-
 RDBMS
RDBMS
-
 Operating System
-
 Java
Java
-
 MS Excel
-
 iOS
iOS
-
 HTML
HTML
-
 CSS
CSS
-
 Android
-
 Python
-
 C Programming
-
 C++
C++
-
 C#
C#
-
 MongoDB
-
 MySQL
MySQL
-
 Javascript
-
 PHP
PHP
-
 Economics & Finance
Selected Reading
How to create the plot of a vector that contains missing values by adding the missing values in base R?
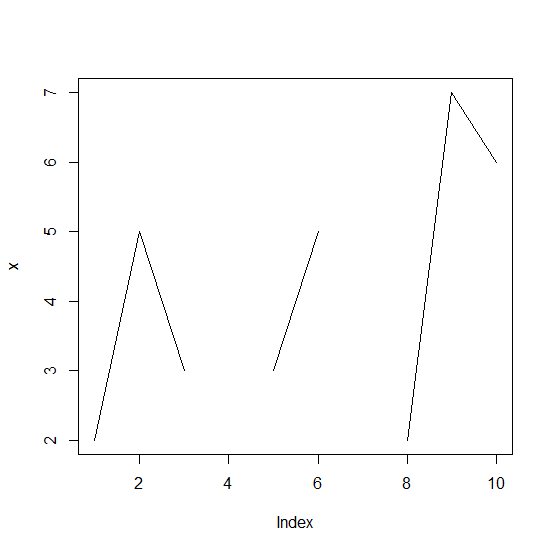
If there are missing values in a vector then the plot of such vector will not have all the values, only the non−missing values will be shown. If we want to create the plot by adding the missing values in the plot then we need to define the X−axis for the length of the vector and the Y−axis with the actual vector using cbind but missing values will be omitted as shown in the below example.
Example
x<−c(2,5,3,NA,3,5,NA,2,7,6)
plot(x,type="l")
Output
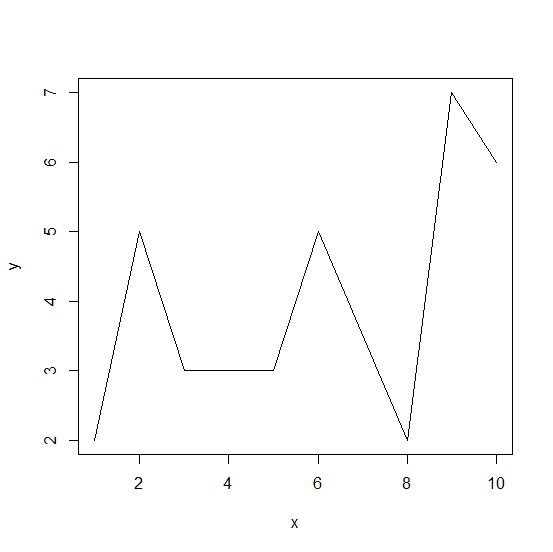
Creating the plot by adding the missing values
Example
plot(na.omit(cbind(x=seq_along(x),y=x)),type="l")
Output

Updated on: 2026-03-11T22:50:55+05:30
462 Views

Advertisements