
Article Categories
- All Categories
-
 Data Structure
-
 Networking
-
 RDBMS
RDBMS
-
 Operating System
-
 Java
Java
-
 MS Excel
-
 iOS
iOS
-
 HTML
HTML
-
 CSS
CSS
-
 Android
-
 Python
-
 C Programming
-
 C++
C++
-
 C#
C#
-
 MongoDB
-
 MySQL
MySQL
-
 Javascript
-
 PHP
PHP
-
 Economics & Finance
Selected Reading
How to create a line that passes through specified points in an R plot?
To create a line that passes through specified points, we first need to create the plot then using plot function then xspline function can be used to join the points with straight lines. The xspline function is specifically designed to draw curves and hence it can be also used to join points in a plot as shown in the below examples.
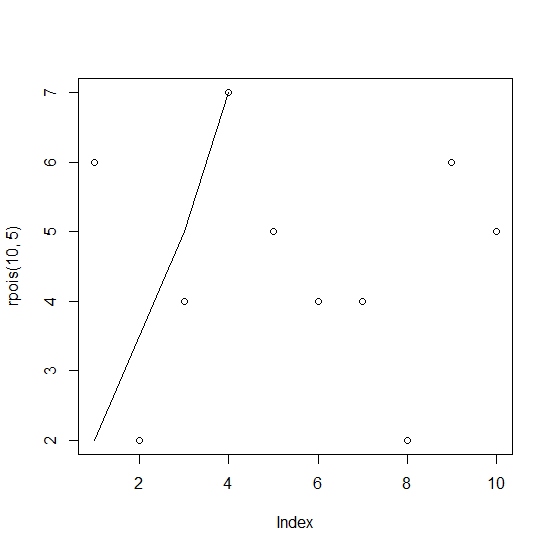
Example1
> plot(rpois(10,5))
> xspline(c(4,3,1),c(7,5,2))
Output:
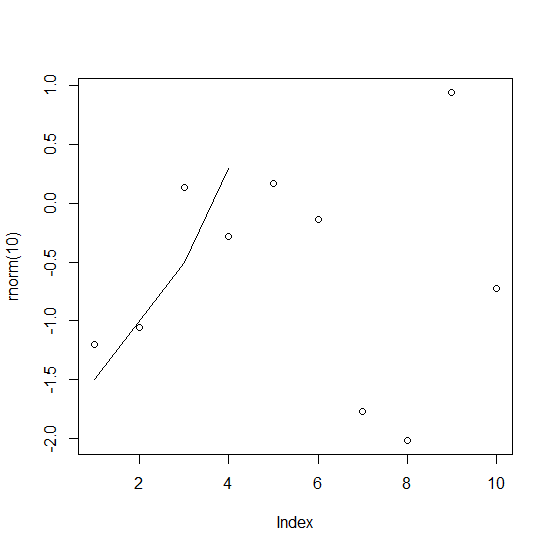
Example2
> plot(rnorm(10))
> xspline(c(4,3,1),c(0.3,-0.5,-1.5))
Output:

Updated on: 2020-11-21T05:20:43+05:30
804 Views

Advertisements