
Article Categories
- All Categories
-
 Data Structure
-
 Networking
-
 RDBMS
RDBMS
-
 Operating System
-
 Java
Java
-
 MS Excel
-
 iOS
iOS
-
 HTML
HTML
-
 CSS
CSS
-
 Android
-
 Python
-
 C Programming
-
 C++
C++
-
 C#
C#
-
 MongoDB
-
 MySQL
MySQL
-
 Javascript
-
 PHP
PHP
-
 Economics & Finance
Selected Reading
How to create vertical line for X variable at median in base R plot
To create vertical line for X variable at median in base R plot, we can follow the below steps −
- First of all, create two vectors and plot them.
- Create the vertical line at median using abline function.
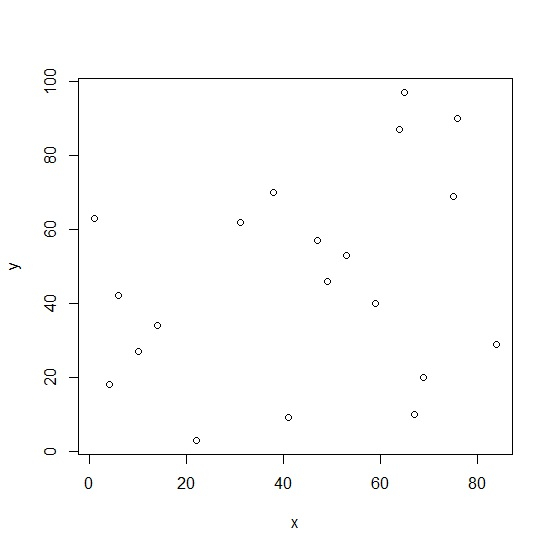
Create the vectors and plot them
Let’s create two random vectors and plot them as shown below −
Example
x<-sample(1:100,20)
y<-sample(1:100,20)
plot(x,y)
On executing, the above script generates the below output(this output will vary on your system due to randomization) −
Output
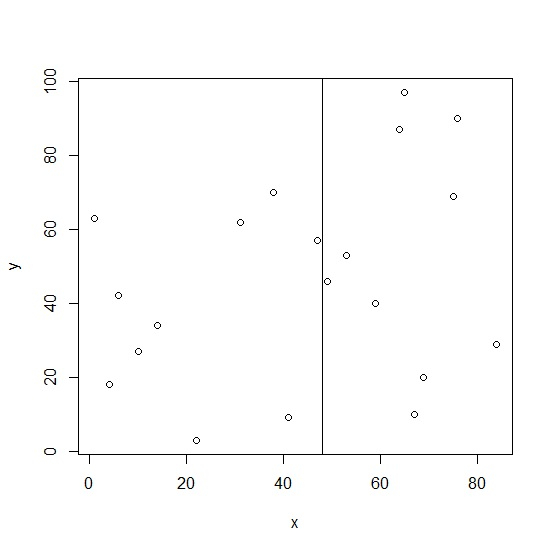
Create the vertical line at median
Use abline function with v argument to create the vertical line at median as shown below −
Example
x<-sample(1:100,20)
y<-sample(1:100,20)
plot(x,y)
abline(v=median(x))
Output

Updated on: 2026-03-11T22:50:58+05:30
490 Views

Advertisements