
Article Categories
- All Categories
-
 Data Structure
-
 Networking
-
 RDBMS
RDBMS
-
 Operating System
-
 Java
Java
-
 MS Excel
-
 iOS
iOS
-
 HTML
HTML
-
 CSS
CSS
-
 Android
-
 Python
-
 C Programming
-
 C++
C++
-
 C#
C#
-
 MongoDB
-
 MySQL
MySQL
-
 Javascript
-
 PHP
PHP
-
 Economics & Finance
How To Display Multiple Charts In One Chart Sheet?
With a wide selection of chart types available, Excel is a potent tool for data analysis and visualisation. While making separate charts for various data sets is helpful, there are times when you might wish to group several charts together on a single chart sheet. Combining charts can make it easier to compare and analyse data trends, provide you a thorough perspective, and improve the overall visual impact.
In this article, we'll look at a variety of Excel display strategies for numerous charts on a single chart page. This post will walk you through the step?by?step process of producing and organising numerous charts on a single sheet, whether you want to compare sales data, track multiple variables through time, or show different elements of your data side by side.
Display Multiple Charts In One Chart Sheet
Here we will first create all the required charts, then move the charts into a single chart to complete the task. So let us see a simple process to know how you can display multiple charts in one chart sheet in Excel.
Step 1
Consider an Excel sheet where you have multiple charts.
First, create an empty chart without selecting any data.
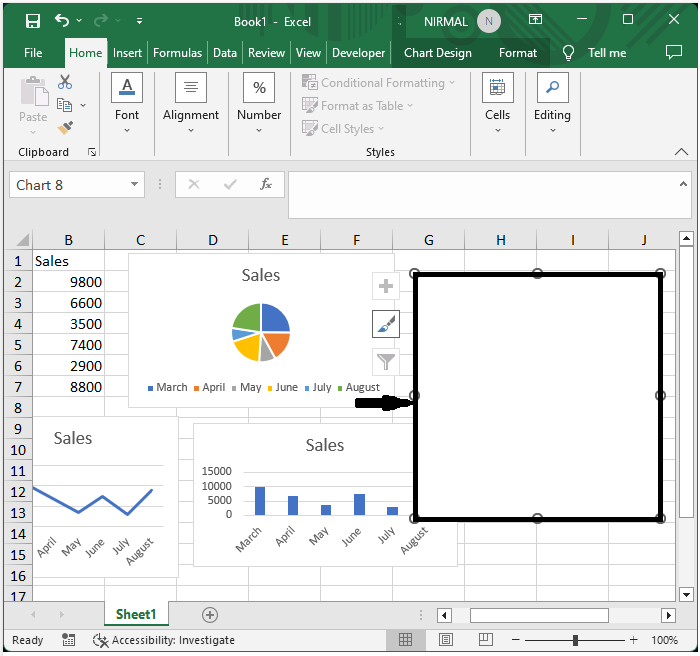
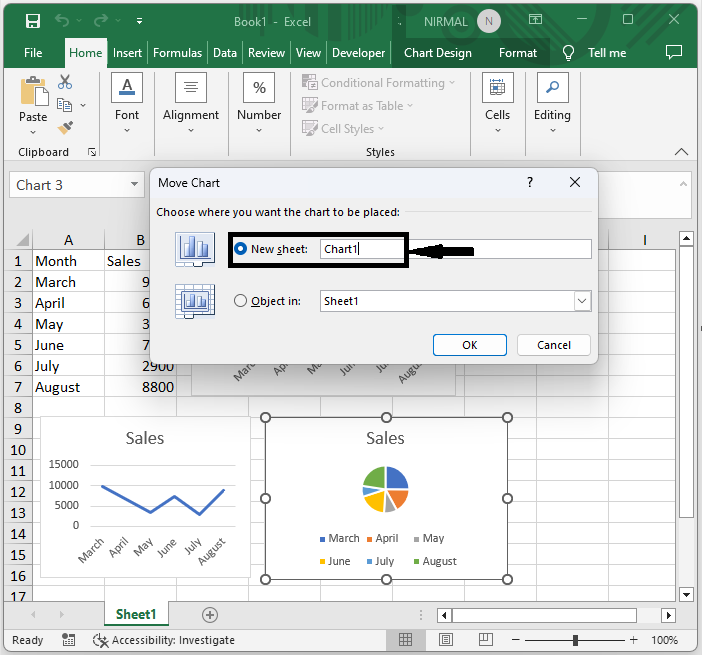
Then right?click on the chart and select "Move chart". In the pop?up, click on "New Sheet" and click OK.
Right click > Move chart > New sheet > Ok.
Step 2
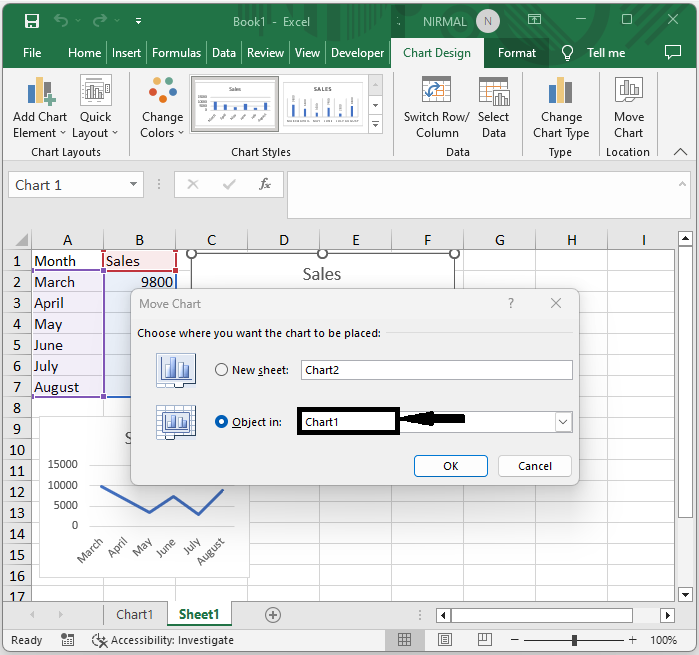
Again, right?click on any one of the charts and click on move. Then in the pop?up, select the object in as Chart1 and click OK.
Right click > Move chart > Object In > Ok.
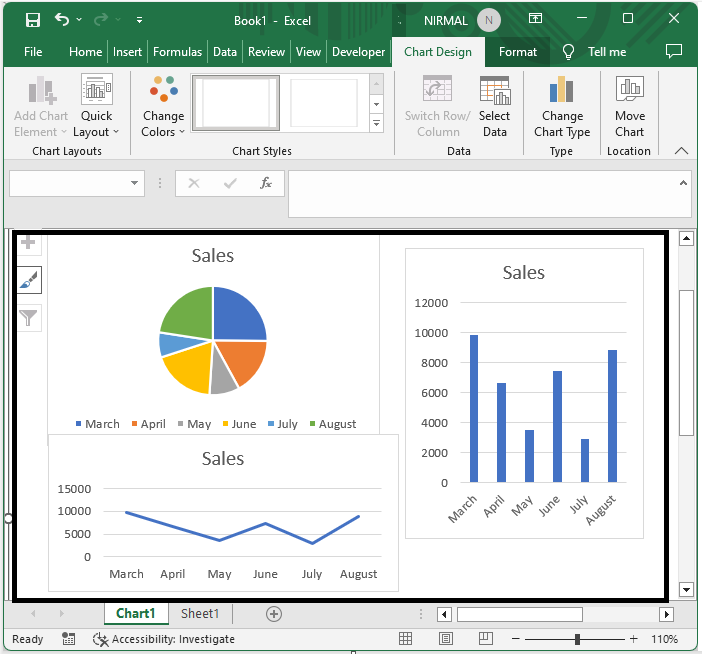
Step 3
Then repeat the same step for all the charts to complete the task.
Conclusion
In this tutorial, we have used a simple example to demonstrate how you can display multiple charts in one chart sheet in Excel to highlight a particular set of data.

6K+ Views
