 Data Structure
 Networking
 RDBMS
RDBMS Operating System
 Java
Java MS Excel
 iOS
iOS HTML
HTML CSS
CSS Android
 Python
 C Programming
 C++
C++ C#
C# MongoDB
 MySQL
MySQL Javascript
 PHP
PHP
- Selected Reading
- UPSC IAS Exams Notes
- Developer's Best Practices
- Questions and Answers
- Effective Resume Writing
- HR Interview Questions
- Computer Glossary
- Who is Who
Histogram in pygal
Pygal is a Python library that is used for creating interactive charts and graphs, one of the charts that Pygal supports is the histogram. Histogram is basically a graphical representation of the distribution of numerical data which helps us to quickly identify patterns, outliers, and trends in a dataset provided. In this article, we will be discussing the basics of histograms and how to create a histogram in Pygal, including the customization of charts and adding data to them.
What is a Histogram?
A histogram is a graphical representation of the distribution of the dataset. It mainly displays the frequency of occurrences of data points in certain intervals, which is also known as bins. The horizontal axis(x-axis) of the histogram chart represents the range of the values that are in the dataset, while the vertical axis(y-axis) represents the frequency of the occurrences of the values in that particular range.
Histograms are particularly used for the visualization of continuous data, such as the weights of the vegetables that are in the basket or the size of the individuals in a population. Histograms allow us to look at the shape of the distribution, including the skewness, and presence of peaks or valleys.
How to create a Histogram in pygal?
Below are the steps that we will follow to create a histogram in Pygal. To create the histogram in Pygal, the initial step is to install the Pygal library. We can do this using pip, the package installer for Python ?
pip install pygal
After we have installed the pygal library, we need to follow the steps given below to create a histogram in pygal ?
Import the ?pygal' module and histogram chart type in the program ?
import pygal
from pygal import Histogram
Create a ?histogram' object and set its x-axis label and title ?
histogram_obj = Histogram(title='Distribution of Scores', x_title='Score Range')
Add the data to the histogram chart using the add() function. We will also pass the data as a list of values or as a dictionary with the bin labels as keys and the bin frequencies as values. Given below is the code to do the same ?
# Add data to the histogram
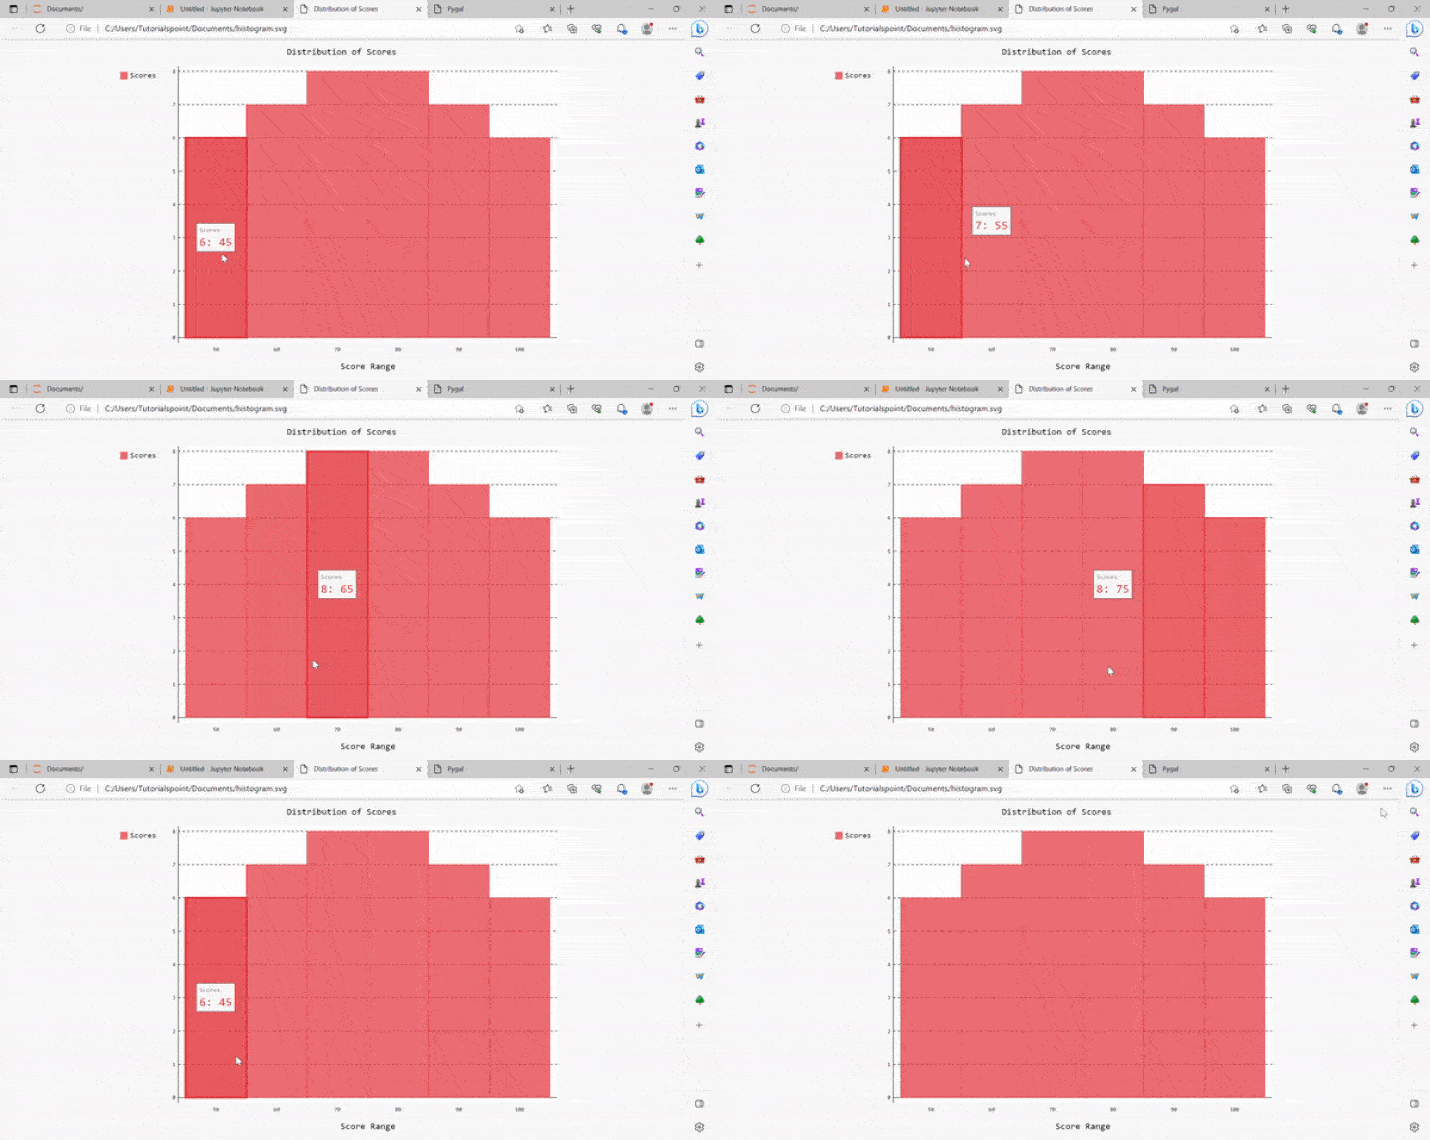
histogram.add('Scores', [(6, 45, 55), (7, 55, 65),(8, 65, 75), (8, 75, 85), (7, 85, 95), (6, 95, 105)])
Use the render_to_file() method to render the chart, which will save the chart as an SVG file ?
# Render the chart to an SVG file
histogram.render_to_file('histogram.svg')
Below is the complete code to create the histogram in Pygal ?
Example
import pygal
from pygal import Histogram

# Create a Histogram object
histogram_obj = Histogram(title='Distribution of Scores', x_title='Score Range')

# Add data to the histogram
histogram_obj.add('Scores', [(6, 45, 55), (7, 55, 65),(8, 65, 75), (8, 75, 85), (7, 85, 95), (6, 95, 105)])

# Render the chart to an SVG file
histogram_obj.render_to_file('histogram_sample.svg')
Output

Customizing the histogram graph
Pygame also allows users to customize the histogram appearance in terms of colors, size, labels, etc. Below are some examples of the customizations we can make to a histogram ?
We can set the size of the graph using the attributes width and height.
We can change the color of the bars using the attribute fill.
We can also show the legend using the attribute legend_at_bottom.
Using the attribute bins, we can set the number of bins in the histogram.
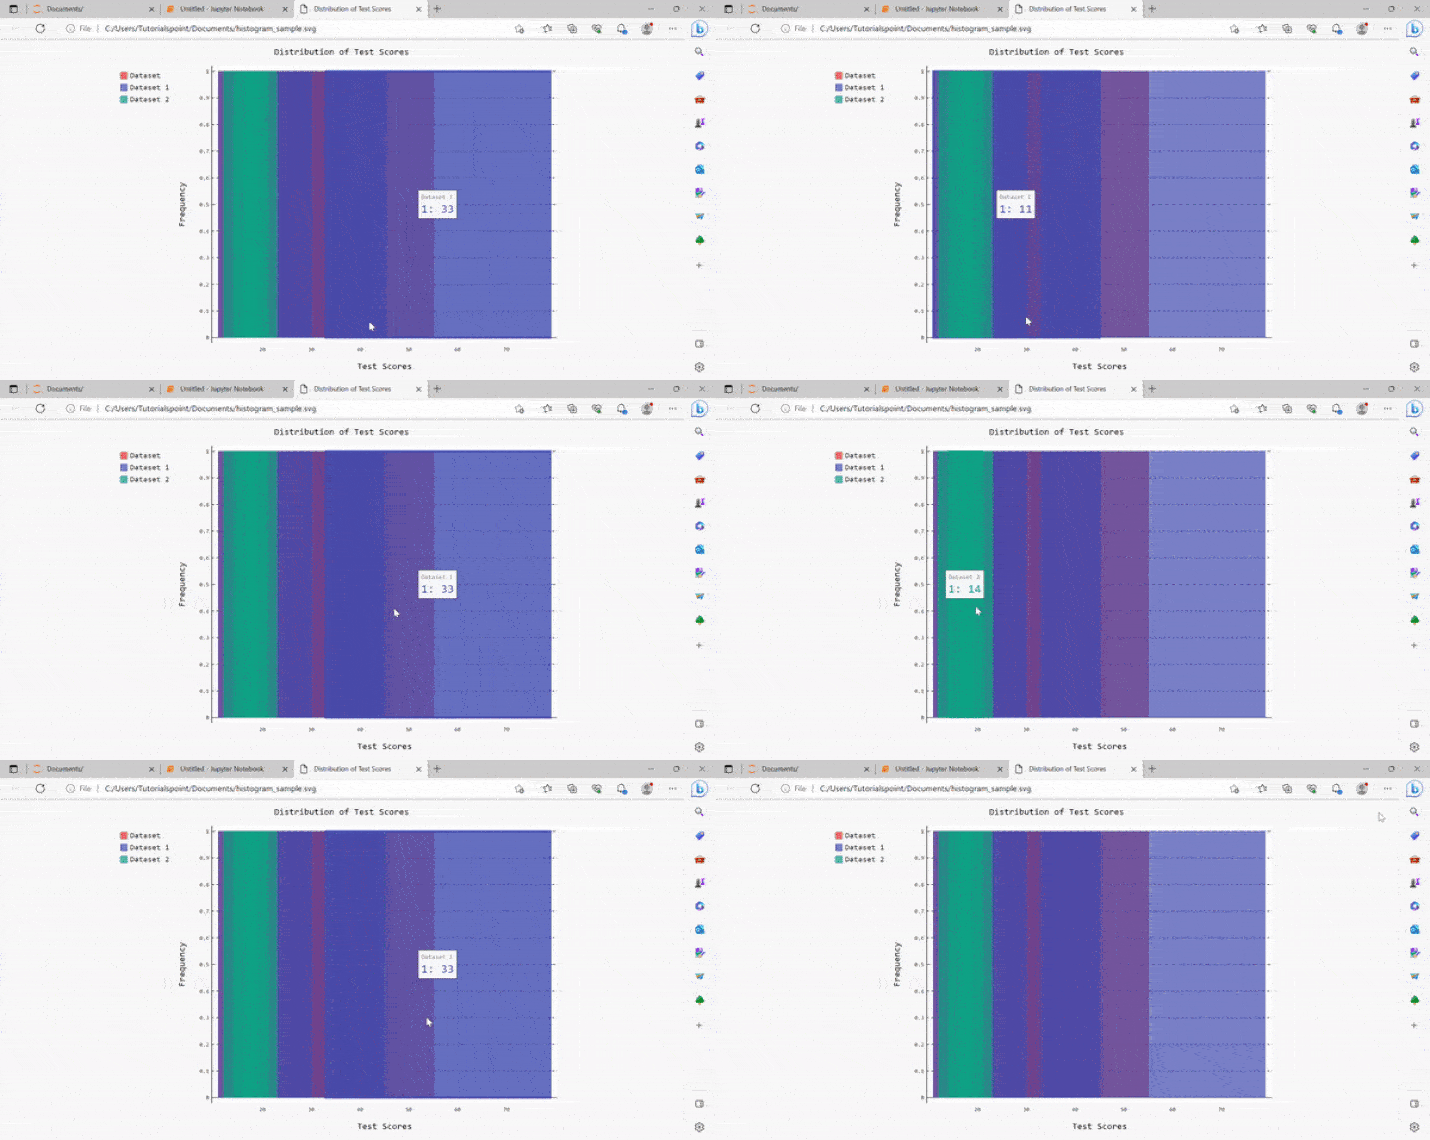
Let us look at an example where we will change the color of the bars and the legend will be shown at the bottom, for this we can modify the Histogram objects like the code given below ?
Example
import pygal
from pygal import Histogram
histogram_ex = pygal.Histogram(title='Distribution of Test Scores', x_title='Test Scores', y_title='Frequency',xrange=(0, 100), yrange=(0, 10))
histogram_ex.add('Dataset', [(11, 22), (12, 33), (13, 44), (14, 55)], bins=5)
histogram_ex.add('Dataset 1', [(23,30), (11,45), (33, 79)],style={'color': 'blue'})
histogram_ex.add('Dataset 2', [(12, 23), (14, 21), (16,19)],style={'color': '#006699'})
histogram_ex.render_to_file('histogram_sample.svg')
Output

Conclusion
In conclusion, creating a histogram in Pygal is a very easy process that allows us to create unique and different visualizations as per the choice of users. We have also discussed Pygal's built-in methods and attributes, using which we can customize various aspects of the histogram, such as colors, titles, labels, and axis range. With the help of the steps given in this article, you will be able to create histograms easily for the datasets.

