 Data Structure
 Networking
 RDBMS
RDBMS Operating System
 Java
Java MS Excel
 iOS
iOS HTML
HTML CSS
CSS Android
 Python
 C Programming
 C++
C++ C#
C# MongoDB
 MySQL
MySQL Javascript
 PHP
PHP
- Selected Reading
- UPSC IAS Exams Notes
- Developer's Best Practices
- Questions and Answers
- Effective Resume Writing
- HR Interview Questions
- Computer Glossary
- Who is Who
Gauge Chart in pygal
Gauge charts are a type of chart used to represent a value or a range of values in a circular format. These charts are similar to speedometer gauges in cars, where a needle points to a particular value on the gauge. Gauge charts can be useful for visualizing data related to performance indicators, such as completion rates or progress towards a goal. In this blog post, we will explore how to create gauge charts using the pygal library in Python.
Installation and Syntax
To use pygal, you first need to install it using Package Manager PIP.
pip install pygal
To create a basic gauge chart using pygal, you can use the following syntax ?
import pygal
# create a gauge chart
gauge_chart = pygal.Gauge()

# add data to the chart
gauge_chart.add('Label', value)

# render the chart
gauge_chart.render_to_file('chart.svg')
Algorithm
Import Pygal library and create a SolidGauge object.
Set the title and inner radius of the gauge chart.
Set the min and max values for the chart.
Add data and ranges to the chart using the add() method.
Use dictionaries to define each data point or range and set their properties.
With the render_to_file() or render_in_browser() methods, you may save the chart as a file or display it in the terminal.
Example
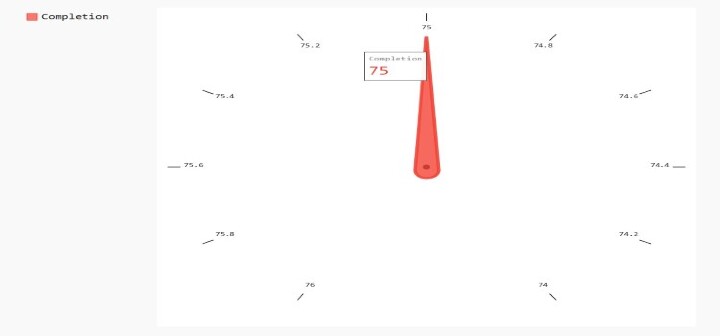
Here is a simple example that creates a gauge chart to represent completion percentage ?
import pygal
#create a gauge chart
gauge_chart = pygal.Gauge()

#add data to the chart
gauge_chart.add('Completion', 75)

#render the chart
gauge_chart.render_to_file('completion_chart.svg')
Output

In this example, we first import the pygal library. We then create a new Gauge chart object using the pygal.Gauge() function. We add data to the chart using the gauge_chart.add() function, which takes a label and a value as arguments. Finally, we render the chart to a file using the gauge_chart.render_to_file() function.
A Complex Example With Several Gauges
import pygal

# create a gauge chart with custom colors and multiple indicators
gauge_chart = pygal.SolidGauge(
   title='My Gauge Chart',
   inner_radius=0.70,
   style=pygal.style.styles['default'](value_font_size=30)
)

# set the min and max values for the chart
gauge_chart.min_value = 0
gauge_chart.max_value = 100


# add the first indicator
gauge_chart.add('Indicator 1', [{'value': 50, 'label': 'First'}], formatter=lambda x: '{:.10g}'.format(x), fill={'start_color': '#00FF00', 'end_color': '#00FF00'})

# add the second indicator
gauge_chart.add('Indicator 2', [{'value': 75, 'label': 'Second'}], formatter=lambda x: '{:.10g}'.format(x), fill={'start_color': '#FFA500', 'end_color': '#FFA500'})

# add the third indicator
gauge_chart.add('Indicator 3', [{'value': 100, 'label': 'Third'}], formatter=lambda x: '{:.10g}'.format(x), fill={'start_color': '#FF0000', 'end_color': '#FF0000'})

# add the ranges for the gauge chart

gauge_chart.add('Low Range', [{'value': 0, 'label': '0%'}, {'value': 30, 'label': '30%'}], fill={'start_color': '#00FF00', 'end_color': '#00FF00'})
gauge_chart.add('Medium Range', [{'value': 30, 'label': '30%'}, {'value': 70, 'label': '70%'}], fill={'start_color': '#FFA500', 'end_color': '#FFA500'})
gauge_chart.add('High Range', [{'value': 70, 'label': '70%'}, {'value': 100, 'label': '100%'}], fill={'start_color': '#FF0000', 'end_color': '#FF0000'})

# render the chart
gauge_chart.render_to_file('gauge_chart.svg')
Output

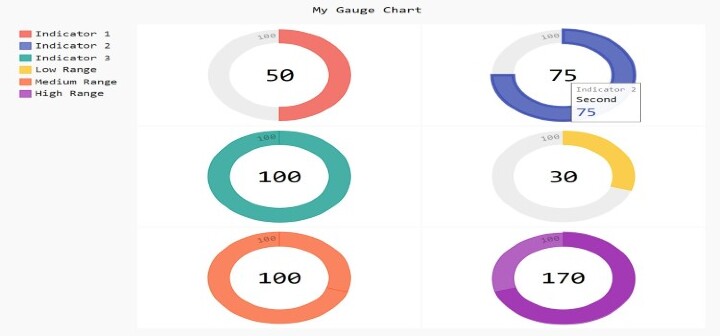
The code imports the Pygal library and creates a new SolidGauge object.
The title of the gauge chart is set to 'My Gauge Chart'.
The inner radius of the gauge chart is set to 0.70, which means that the chart will have a circular hole in the center.
The style of the chart is set to the default Pygal style, with a font size of 30.
The minimum and maximum values for the chart are set to 0 and 100, respectively.
Three indicators are added to the chart with their corresponding values and labels.
Each indicator has a different color, specified by the fill attribute in the add method.
A formatter is used to format the value of each indicator. In this case, the formatter rounds the value to 10 decimal places.
Three ranges are added to the chart with their corresponding values and labels.
Each range has a different color, specified by the fill attribute in the add method.
The chart is saved as an SVG file with the name "gauge chart.svg" using the render to file function.
Applications
A wide range of statistics, such as completion rates, forward movement towards a goal, and performance measures, may be represented using gauge charts. For displaying data that falls inside a certain range, such a percentage or a score, they are very helpful. The ability to quickly and easily highlight areas that need improvement makes them useful for showing data that calls for immediate attention or action. To make the data more aesthetically pleasing and understandable, you can customize them with arguments passed in python functions to set various colors and designs.
Conclusion
A wonderful approach to display data that falls inside a given range or aim is with gauge charts. Python gauge chart creation is made quick and easy using the Pygal module. It may be used for a variety of applications, from straightforward data visualization to the building of complicated dashboards, thanks to its straightforward syntax and customization capabilities. It is essential to remember that gauge charts can be interpreted differently based on the user and the environment. Gauge charts must be used in a way that correctly communicates the desired information without misleading or confusing the audience.

