 Data Structure
 Networking
 RDBMS
RDBMS Operating System
 Java
Java MS Excel
 iOS
iOS HTML
HTML CSS
CSS Android
 Python
 C Programming
 C++
C++ C#
C# MongoDB
 MySQL
MySQL Javascript
 PHP
PHP
- Selected Reading
- UPSC IAS Exams Notes
- Developer's Best Practices
- Questions and Answers
- Effective Resume Writing
- HR Interview Questions
- Computer Glossary
- Who is Who
Plotting World Map Using Pygal in Python
With the help of the Pygal library of Python, we can create stunning world maps in Python as it provides different function to create and customize the graphs. This article explores the step-by-step process of plotting a world map, customizing the map's style, adding data to highlight countries or regions, and rendering the map to an SVG file. Whether you want to visualize geographic data, showcase international statistics, or create interactive visualizations, Pygal provides a powerful toolset for displaying global information with ease.
How to plot world map using pygal in Python?
Plotting countries on the world map
Below are the steps that we will follow to plot countries on the world map ?
We import the pygal.maps.world module to create a world map. We create an instance of the World class to represent the map.
We set the title of the map to 'Countries of the World' using the title attribute.
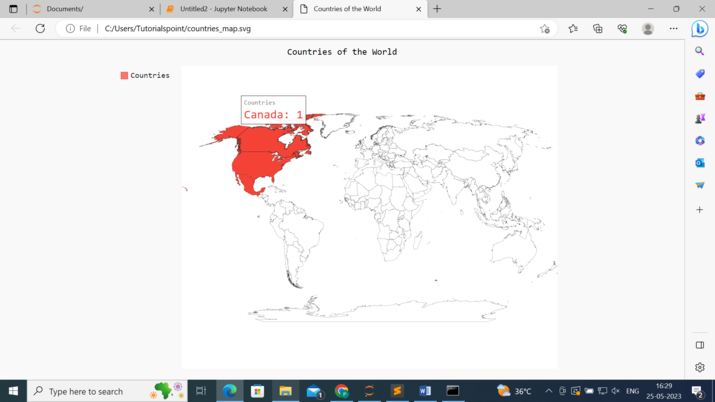
We add data to the map using the add() method. In the below example, we provide a list of tuples where each tuple represents a country and its associated data. The first element of each tuple is the two-letter country code (e.g., 'ca' for Canada, 'us' for the United States, and 'mx' for Mexico), and the second element is the data value (here, all countries have a value of 1).
Finally, we render the map to an SVG file using the render_to_file() method, specifying the desired filename ('countries_map.svg' in this case).
While running the program, it will generate an SVG file that represents the world map with the specified title and the countries Canada, USA, and Mexico highlighted on the map.
Example
import pygal.maps.world

# Create a world map object
worldmap = pygal.maps.world.World()

# Set the title of the map
worldmap.title = 'Countries of the World'

# Add data to the map
worldmap.add('Countries', [('ca', 1), ('us', 1), ('mx', 1)])  # Canada, USA, Mexico

# Render the map to an SVG file
worldmap.render_to_file('countries_map.svg')

Plotting continents on the world map
Follow the steps given below to plot continents in the world map ?
Import the necessary module ? The program example given below starts by importing the `pygal.maps.world` module, which provides the functionality to create world maps.
Create a world map object ? An instance of the `World` class is created using `pygal.maps.world.World()`. This object represents the world map that will be plotted.
Set the title ? The `title` attribute of the world map object is set to 'Continents'. This will be the title displayed on the map.
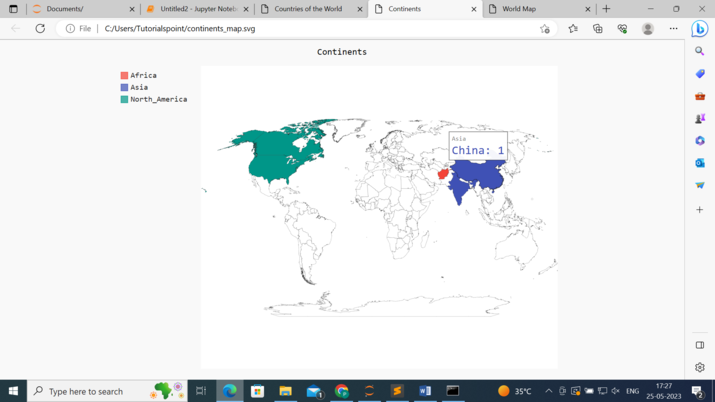
Define a dictionary mapping countries to continents ? The program below defines a dictionary `country_to_continent`, where each country's two-letter code is mapped to its corresponding continent. The example includes mappings for countries like 'af' (Africa), 'cn' and 'in' (Asia), 'us' and 'ca' (North America). You can add more country-to-continent mappings as needed.
Plot the continents by adding countries ? The program below iterates over the unique continents present in the `country_to_continent` dictionary. For each continent, it extracts the countries belonging to that continent and adds them to the world map using the `add()` method. The continent's title is used as the series name, and the associated countries are specified as a list.
Render the map to an SVG file ? Finally, the world map is rendered to an SVG file named 'continents_map.svg' using the `render_to_file()` method. This generates the visual representation of the world map with the highlighted continents.
Example
import pygal.maps.world

# Create a world map
worldmap = pygal.maps.world.World()

# Set the title
worldmap.title = 'Continents'

# Define a dictionary mapping countries to continents
country_to_continent = {
   'af': 'africa',
   'cn': 'asia',
   'in': 'asia',
   'us': 'north_america',
   'ca': 'north_america',
   # Add more country-to-continent mappings here
}
# Plot the continents by adding countries belonging to each continent
for continent in set(country_to_continent.values()):
   countries = [country for country, cont in country_to_continent.items() if cont == continent]
   worldmap.add(continent.title(), countries)

# Render the map to an SVG file
worldmap.render_to_file('continents_map.svg')
Output

Plotting World Map with Labels
Below are the steps that we will follow to plot the world map with labels ?
Create a world map object ? The program starts by creating an instance of the World class from the pygal.maps.world module. This object represents the world map that will be plotted.
Set the title ? The program sets the title attribute of the world map object to 'World Map'. This will be the title displayed on the map.
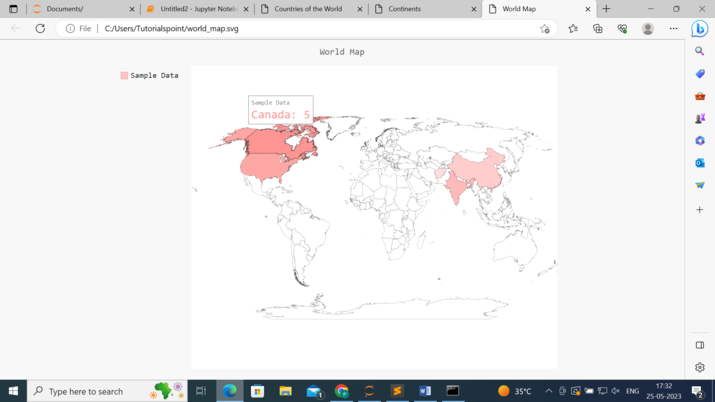
Customize the style of the map ? The program customizes the style of the map by assigning the LightColorizedStyle from the pygal.style module to the style attribute of the world map object. This style provides a light color scheme to the map. You can explore other available styles or create your own custom styles.
Add data to the map (optional) ? The program uses the add() method of the world map object to add data to the map. In this example, the data is provided as a dictionary where the keys are the two-letter country codes (e.g., 'af' for Afghanistan, 'cn' for China, 'in' for India, 'us' for the United States, and 'ca' for Canada), and the values represent the associated data for each country.
Render the map to an SVG file ? Finally, the world map is rendered to an SVG file using the render_to_file() method of the world map object. The file is saved with the name 'world_map.svg'.
Example
import pygal.maps.world

# Create a world map
worldmap = pygal.maps.world.World()

# Set the title
worldmap.title = 'World Map'

# Customize the style of the map
worldmap.style = pygal.style.LightColorizedStyle

# Add data to the map (optional)
worldmap.add('Sample Data', {'af': 1, 'cn': 2, 'in': 3, 'us': 4, 'ca': 5})

# Render the map to an SVG file
worldmap.render_to_file('world_map.svg')
Output

Conclusion
In conclusion, Pygal proves to be a powerful and user-friendly tool for plotting world maps in Python. With its intuitive syntax and extensive customization options, we can effortlessly create visually stunning representations of global data. By harnessing the potential of Pygal, we can unlock a world of possibilities for data visualization and effectively communicate our insights to a wider audience.

