
Article Categories
- All Categories
-
 Data Structure
-
 Networking
-
 RDBMS
RDBMS
-
 Operating System
-
 Java
Java
-
 MS Excel
-
 iOS
iOS
-
 HTML
HTML
-
 CSS
CSS
-
 Android
-
 Python
-
 C Programming
-
 C++
C++
-
 C#
C#
-
 MongoDB
-
 MySQL
MySQL
-
 Javascript
-
 PHP
PHP
-
 Economics & Finance
How to rotate the X label using Pygal?
Pygal is a Python library that is used to create interactive, customizable charts and graphs. We can rotate the x-axis label using the x_label_rotation attribute in the Pygal module. The rotation of the x-axis label makes the chart easier to read and comprehend when dealing with long labels or limited space.
Algorithm
A general algorithm for rotating the x label using pygal is given below ?
Import the Pygal module.
Create a chart object (e.g., Bar, Line, Pie, etc.).
Add data to the chart using the add method.
Set the x-axis labels using the x_labels attribute.
Set the rotation angle for the x-axis labels using the x_label_rotation attribute.
Render the chart using the render_to_file or render_to_png method.
Syntax
chart.x_label_rotation = rotation_angle
Here, the chart is the Pygal chart object and rotation_angle is the angle (in degrees) by which you want to rotate the x-axis labels.
Step 1: Install Pygal
The first step is to install the required modules. We need to install the Pygal module to create charts using it. To install the Pygal module simply type the below command in your terminal or command prompt ?
pip install pygal
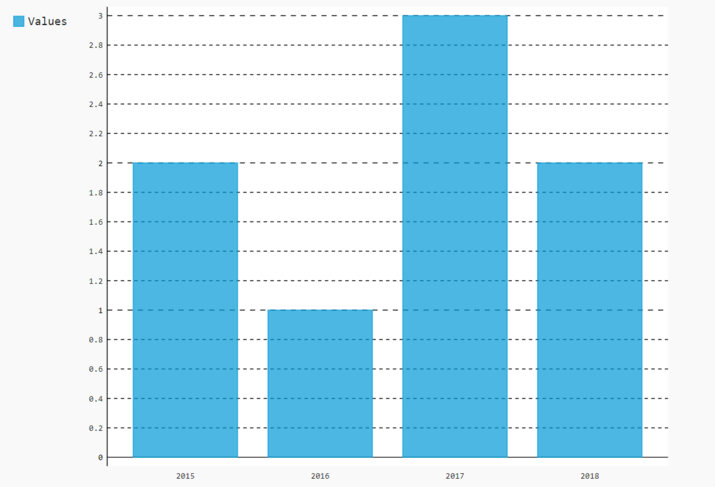
Step 2: Create a Chart with Normal X-label
In this step, we need to import the Pygal module and start creating our chart. We will create a Bar chart showing the values in different years from 2015-2018. To draw the chart we need to add values and labels to the Pygal bar chart. The render_to_file() function renders the created chart to an SVG file ?
import pygal
from pygal.style import Style

style_config = {
    "colors": ("#0099d6", "#0099d6", "#6d6f71", "#6d6f71"),
}

# Create a bar chart
bar_chart = pygal.Bar(style=Style(**style_config))

# Set x-axis labels
bar_chart.x_labels = ['2015', '2016', '2017', '2018']

# Add data to the chart
bar_chart.add('Values', [2, 1, 3, 2])

# Render the chart
bar_chart.render_to_file('pets.svg')
Output
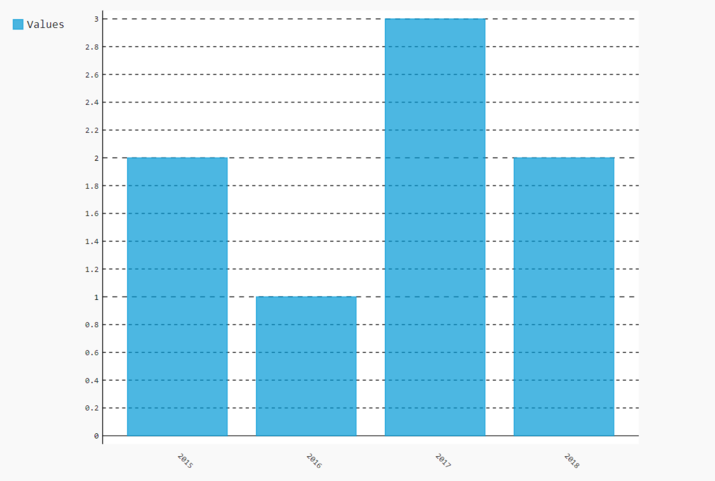
Step 3: Rotate the X Labels
By default, the pygal module shows the x-labels horizontally. To rotate the x-labels we use the x_label_rotation attribute. This attribute takes an integer value that represents the rotation angle in degrees. For example, if we give a value of 90 to x_label_rotation, it will rotate the labels by 90 degrees clockwise.
To rotate the x_label by 45 degrees, we can add the line bar_chart.x_label_rotation=45 to the above code. The full code for the rotated x-label is shown below ?
import pygal
from pygal.style import Style

style_config = {
    "colors": ("#0099d6", "#0099d6", "#6d6f71", "#6d6f71"),
}

# Create a bar chart
bar_chart = pygal.Bar(style=Style(**style_config))

# Set x-axis labels
bar_chart.x_labels = ['2015', '2016', '2017', '2018']

# Add data to the chart
bar_chart.add('Values', [2, 1, 3, 2])

# Rotate the x-axis labels by 45 degrees
bar_chart.x_label_rotation = 45

# Render the chart
bar_chart.render_to_file('pets_rotated.svg')
Output
Common Rotation Angles
| Rotation Angle | Effect | Best For |
|---|---|---|
| 0 | Horizontal (default) | Short labels |
| 45 | Diagonal | Medium-length labels |
| 90 | Vertical | Long labels or many categories |
| -45 | Counter-clockwise diagonal | Alternative diagonal orientation |
Conclusion
The x_label_rotation attribute in Pygal allows you to rotate x-axis labels to improve readability when dealing with long text or limited chart space. You can use any rotation angle in degrees to achieve the desired label orientation for your chart.

357 Views
