 Data Structure
 Networking
 RDBMS
RDBMS Operating System
 Java
Java MS Excel
 iOS
iOS HTML
HTML CSS
CSS Android
 Python
 C Programming
 C++
C++ C#
C# MongoDB
 MySQL
MySQL Javascript
 PHP
PHP
- Selected Reading
- UPSC IAS Exams Notes
- Developer's Best Practices
- Questions and Answers
- Effective Resume Writing
- HR Interview Questions
- Computer Glossary
- Who is Who
Funnel Chart in Pygal
A particular sort of chart that is frequently used to show the steps in a process is a funnel chart and it is named so due to its funnel-like design, which has a broad top and a small bottom. The chart sections are divided into stages, and the quantity of things that move through each stage is indicated by the size of each section. We'll learn how to make a funnel chart in Pygal, a Python framework for making interactive charts, in this tutorial.
Installation and Syntax
Pygal must first be installed using pip before it can be used so type the following in your terminal
pip install pygal
With Pygal, you must first construct a Funnel object and then add data to it using the add function in order to generate a funnel chart. The chart may then be altered by changing properties like the title, labels, colors, and font size.
Algorithm
Import the pygal module using import pygal.
Create a Funnel chart object using pygal.Funnel().
Add data to the Funnel chart using the add() method, passing in the following arguments ?
A label for the data being added
A list or tuple of values representing the data points to be plotted
Set various attributes of the Funnel chart using its various methods, such as ?
chart.title = "My Funnel Chart": set the chart's title
chart.legend_at_bottom = True: display the legend at the bottom of the chart
chart.x_labels = ['Step 1', 'Step 2', 'Step 3', 'Step 4']: set the x-axis labels
chart.colors = ['#FFA07A', '#00CED1', '#FFD700', '#ADFF2F']: set the colors of the data points
chart.value_font_size = 20: set the font size of the values displayed on the chart
Customize the Funnel chart further using other available methods, such as ?
chart.margin_bottom = 50: set the bottom margin of the chart
chart.print_values = True: display the values on the chart
chart.show_legend = False: hide the legend on the chart
chart.human_readable = True: format large values with commas for better readability
Render the Funnel chart to a file using
chart.render_to_file('my_funnel_chart.svg'),
chart.render_to_png('my_funnel_chart.png'), or
chart.render_to_svg('my_funnel_chart.svg').
Display the Funnel chart in the console using chart.render().
Example 1: Basic Funnel Chart
import pygal

# Create a Funnel object
funnel = pygal.Funnel()

# Add data to the funnel
funnel.add("Visits", 1000)
funnel.add("Signups", 500)
funnel.add("Purchases", 100)

# Render the funnel to a file
funnel.render_to_file("funnel.svg")
Output

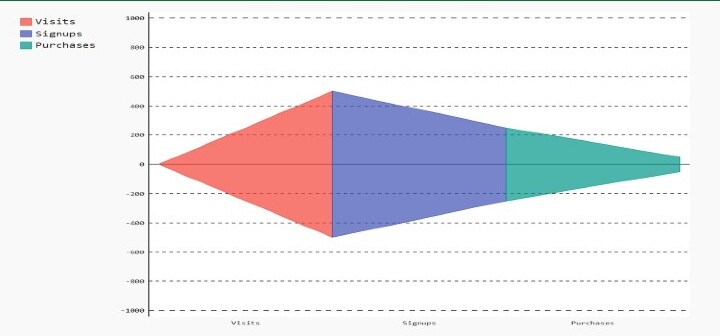
In this example, we create a Funnel object and add three stages to it: "Visits", "Signups", and "Purchases". We then set the number of items that pass through each stage: 1000 visits, 500 signups, and 100 purchases. Finally, we render the funnel to an SVG file called "funnel.svg".
Example 2: Customized Funnel Chart
import pygal

# Create a Funnel object
funnel = pygal.Funnel(width=600, height=400, margin=50,
   title="Conversion Rates", x_title="Steps", y_title="Number of Users")

# Add data to the funnel
funnel.add("Visits", 1000, color="#ff0000")
funnel.add("Signups", 500, color="#00ff00")
funnel.add("Purchases", 100, color="#0000ff")

# Render the funnel to a file
funnel.render_to_file("funnel.svg")
Output

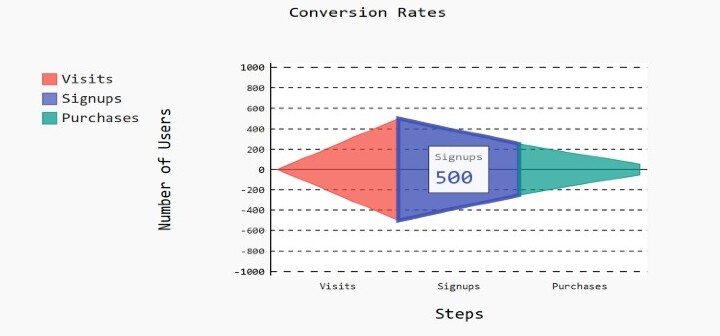
In this example, we create a Funnel object and customize various attributes of the chart. We set the width to 600 pixels, the height to 400 pixels, and the margin to 50 pixels. We also set the title of the chart to "Conversion Rates" and the labels for the x-axis and y-axis. We then add three stages to the funnel with custom colors, and render the chart to an SVG file called "funnel.svg".
import pygal

# Create a Funnel object
funnel = pygal.Funnel(width=600, height=400, margin=50,
   title="Conversion Rates",
x_title="Steps", y_title="Number of Users", print_values=True, print_labels=True)

# Add data to the funnel
funnel.add("Visits", 1000, color="#ff0000")
funnel.add("Signups", 500, color="#00ff00")
funnel.add("Purchases", 100, color="#0000ff")

# Set the style of the funnel
funnel.style = pygal.style.DefaultStyle(title_font_size=20, label_font_size=16,
value_font_size=14, value_label_font_size=12)

# Set the legend to appear at the bottom
funnel.legend_at_bottom = True

# Render the funnel to a file
funnel.render_to_file("funnel.svg")
Output

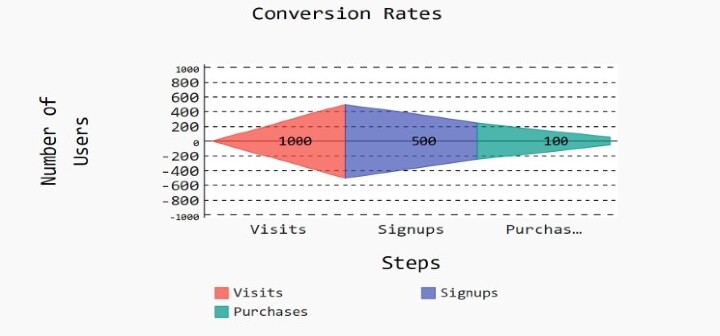
Start with a `Funnel` object with various customizations. We set the width to 600 pixels, the height to 400 pixels, and the margin to 50 pixels. We set the title of the chart to "Conversion Rates" and the labels for the x-axis and y-axis. We also enable the printing of values and labels for each stage of the funnel. We then add three stages to the funnel with custom colors. We set the style of the chart to the `DefaultStyle` with custom font sizes for the title, labels, values, and value labels. We set the legend to appear at the bottom of the chart. Finally, we render the chart to an SVG file called "funnel.svg".
Applications
In a wide range of applications, funnel charts are helpful for displaying data, including ?
Examination of the many stages of a sales process, including leads, opportunities, and concluded transactions, may be done using funnel charts.
Marketing Funnel Analysis ? Using funnel diagrams, you may examine the many stages of a marketing campaign, including website visits, form fills, and email opt-ins.
Funnel charts may be used to pinpoint process steps where consumers are losing interest and then improve those steps for higher conversion rates.
Conclusion
In this article, we learned how to create a funnel chart in Pygal, a Python library for creating interactive charts. We covered the installation and setup of Pygal, the syntax for creating a funnel chart, and some small and big examples. We also discussed the applications of funnel charts in various industries, including sales, marketing, and conversion rate optimization. With the knowledge gained from this article, you can now create your own funnel charts in Python using Pygal.

